IN THIS LIST

U.S. Persistence Scorecard Year-End 2021

SPIVA Canada Year-End 2021

SPIVA Japan Year-End 2021

Europe Persistence Scorecard: Year-End 2021

SPIVA Japan Year-End 2022

U.S. Persistence Scorecard Year-End 2021

SUMMARY

Should investment results be attributed to skill or luck? Genuine skill is likely to persist, while luck is random and fleeting. Thus, one measure of skill is the consistency of a fund’s performance relative to its peers or to its benchmark. The Persistence Scorecard shows that regardless of asset class or style focus, active management outperformance is typically short-lived, with few funds consistently outranking their peers or benchmarks.

Recent years illustrate this point quite well. Exhibit 1 shows that the top-quartile funds of 2019 often continued to lead the way in 2020. Had these funds developed a consistent winning strategy? Sadly, no. Even with the bull market extending into 2021, these funds quickly reverted to the mean, and only 2.2% of the 2019 domestic equity winners remained in the top quartile by 2021.

U.S. Persistence Scorecard Year-End 2021: Exhibit 1

If we extend the time horizon to five years, the picture looks still more bleak. Even selecting for the category with the highest observed persistence, just 3.5% of large-cap funds stayed in the top quartile each year. Mid-cap and small-cap funds displayed poorer persistence across all horizons, with no small-cap fund remaining in the top quartile for five years.

Some statistically minded readers might note that these numbers are occasionally better than what would be expected if fund performance were randomly distributed. For example, the odds that a top-quartile fund in one year could remain in the top quartile for the next four consecutive years might be calculated as (25%)4 = 0.39%, and the 3.5% referenced previously is substantially better than that.  While the persistence report does not prove that fund performance is completely random, from a practical or decision-making perspective, it reinforces the notion that choosing between active funds on the basis of previous outperformance is likely a misguided strategy. After all, there remains a 96.5% chance that a top-quartile fund will not stay in the top quartile consistently for the next four years.

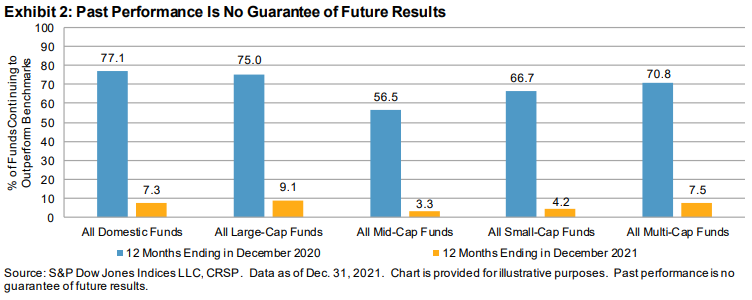
Another way of evaluating performance persistence is by comparing performance against fund benchmarks, rather than against peer groups. Any fund alpha quickly proved fleeting viewed under this lens as well. For example, out of 791 large-cap equity funds, 232 (29.33%) beat the S&P 500® in 2019. As might be expected from the previous statistics, there was significant follow-on for 2020, with 174 of those 232 (75.0%) continuing to put up positive alpha for the next year. Fast-forward to the end of 2021, and only 21 funds (9.1%) repeated their outperformance over the benchmark.

U.S. Persistence Scorecard Year-End 2021: Exhibit 2

Unsurprisingly, the one pattern that did hold across equity funds was the tendency of the poorest-performing funds to close. Fourth-quartile funds were almost always the most likely to merge or liquidate over the subsequent three- and five-year windows, as 142 out of the 484 All Domestic Funds (29.3%) classed as bottom quartile from the December 2011–December 2016 period closed their doors within the next five years.

Fixed income funds showed results similar to equities, as strong one-year persistence soon reversed course. In 11 of the 13 categories considered, not a single top-quartile fund from 2017 maintained that status annually through 2021. Across all fixed income categories, a nearly identical 28.9% (63 out of 218 funds) of bottom-quartile funds from the December 2011-December 2016 period were consigned to the history books within five years.

pdf-icon PD F Download Full Article

SPIVA Canada Year-End 2021

The S&P/TSX Composite posted 25.1% in 2021, its best return in the past 10 years. The S&P/TSX Canadian Dividend Aristocrats® and the S&P 500® (CAD) also garnered significant returns of 26.0% and 27.6%, respectively.

In 2021, 67% of Canadian Equity funds underperformed their benchmark. Consistent with previous evidence over 10-year time frames, a majority of active managers in every fund category lagged their benchmarks, providing a compelling case for passive investing.

SPIVA Canada Year-End 2021: Exhibit 1

U.S. Equity funds were particularly notable for their level of underperformance. On an equal-weighted basis, U.S. Equity funds underperformed the S&P 500 (CAD) by 5.9% over the past year, the worst relative performance of any fund category.

U.S. Equity funds posted a 20.2% gain on an asset-weighted basis, starkly lower than the 27.6% return for the S&P 500 (CAD), the best-performing benchmark. U.S. equities have offered the best returns over the past decade, with the S&P 500 (CAD) gaining 15.1% annualized, yet active funds were unable to keep up: 90% fell short, by an average of 4% per year on an equal-weighted basis.

Canadian Dividend & Income Equity funds posted the highest returns over the past year across funds, with a 25.7% return on an asset-weighted basis. However, 65% of funds in this category still lagged their benchmark.

The smaller-cap names of the S&P/TSX Completion Index finished 2021 up 14.9%, underperforming the Canadian Small-/Mid-Cap Equity funds, as just 13% failed to beat the S&P/TSX Completion Index. Less triumphant, but recently edging closer to parity, 59% and 57% of funds in this category fell short against their benchmark over the 5- and 10-year periods, respectively.

Despite outperforming their benchmark by 1.8% for 2021, Canadian Focused Equity funds were also notable for having the worst chances of beating the index over the 10-year period, with just 6 of 128 funds (4.7%) surpassing the blended target. Only 43% of these funds survived the decade, the worst survivorship of any category.

International Equity funds did slightly worse on a relative basis over the past six months, with 67% underperforming the benchmark, up from 58% at mid-year 2021. Global Equity funds also added little credence to the track record of active management, with 83% underperforming the 20.4% gain of the S&P Developed LargeMidCap (CAD).

Taking a look through a size lens, larger funds in Canada continued to outperform their smaller counterparts as 17, down from 22 at mid-year 2021, of the 28 results showed higher asset-weighted returns across the seven fund categories and four time horizons studied.

The SPIVA Scorecards' accounting for survivorship bias continues to provide a valuable caution for asset allocators, as 40% of all funds in the eligible universe 10 years ago have since been liquidated or merged.

pdf-icon PD F Download Full Article

SPIVA Japan Year-End 2021

Contributor Image
Priscilla Luk

Managing Director, Global Research & Design, APAC

S&P Dow Jones Indices

Contributor Image
Tim Wang

Senior Analyst, Global Research & Design

S&P Dow Jones Indices

SUMMARY

  • S&P Dow Jones Indices has been the de facto scorekeeper of the ongoing active versus passive debate since the first publication of the SPIVA U.S. Scorecard in 2002. Over the years, we have built upon our experience by expanding scorecard coverage into Australia, Canada, Europe, India, South Africa, Latin America, the Middle East and North Africa, and Japan.  While this report will not end the debate surrounding active versus passive investing in Japan, we hope to make a meaningful contribution by examining market segments in which one strategy performs better than the other.
  • The SPIVA Japan Scorecard reports on the performance of actively managed Japanese mutual funds against their respective benchmark indices over 1-, 3-, 5-, and 10-year investment horizons. In this scorecard, we evaluated the returns of more than 774 Japanese large- and mid-/small-cap equity funds, more than 818 international equity funds investing in global, international, and emerging markets, as well as U.S. equities.
  • Japanese Equity Funds: In 2021, the S&P/TOPIX 150 and the S&P Japan MidSmallCap gained 7% and 8.8%, respectively. Over the same period, 64.7% and 55.8% of large- and mid-/small-cap equity funds underperformed their respective benchmarks, with equal-weighted average returns of 13.0% and 7.8%, respectively. Active domestic equity fund performance relative to the benchmark in 2021 was worse than in 2020, with much higher percentages of funds underperforming the benchmark.

Over the 10-year horizon, 18.1% and 52.8% of large- and mid-/small-cap funds managed to outperform their benchmarks, while 38.3% and 33.5% were liquidated, respectively.  The equal- and asset-weighted average returns of Japanese large-cap funds lagged the benchmark by 0.46% and 0.44%, respectively, while the mid-/small-cap funds reported annualized excess returns of 3.3% and 1.2% on equal- and asset-weighted bases, respectively.  Japanese mid-/small-cap funds tended to deliver higher benchmark-relative excess return compared with Japanese large-cap funds across different periods.

  • Foreign Equity Funds: In 2021, more active funds underperformed their benchmarks than in 2020 across all foreign equity fund categories. More than 80% of U.S., global, and international equity funds underperformed their respective benchmarks, and 68.8% of emerging equity funds lagged the S&P Emerging BMI.  For 2021, all foreign equity fund categories recorded worse average return than their respective benchmark indices.  In particular, the equal-weighted and asset-weighted average return of global equity funds lagged the S&P Global 1200® by 11.1% and 20.6% respectively.

Over the 10-year period, the vast majority of foreign equity funds did not outperform their respective benchmarks.  Less than 10% of global, international, and emerging equity funds outperformed their respective benchmarks, while only 17.2% of U.S. equity funds beat the S&P 500®.  However, U.S. equity funds underperformed most in their benchmark-relative returns, with annualized excess returns of -6.2% and -5.9% on equal- and asset-weighted bases, respectively.  Foreign equity funds had a 10-year liquidation rate of 50.2%, which was much higher than that of domestic equity funds (36.5%).

SPIVA Japan Year-End 2021: Exhibit 1

pdf-icon PD F Download Full Article

Europe Persistence Scorecard: Year-End 2021

Contributor Image
Andrew Cairns

Senior Director, Global Research & Design

S&P Dow Jones Indices

Contributor Image
Andrew Innes

Head of Global Research & Design

S&P Dow Jones Indices

INTRODUCTION

The Europe Persistence Scorecard aims to differentiate skill from luck by examining the ability of active European equity funds to consistently outperform their peers and their benchmark.  This scorecard looks to support the well-known disclaimer that past performance is not indicative of future results and that oftentimes an investor may have better success in selecting a fund at random rather than from a group of top performers.

In this report, we pose two questions: did top funds stay ahead of the pack, and did outperforming funds continue to beat their benchmark?

YEAR-END 2021 HIGHLIGHTS

Pan-European Equity Funds: Looking at the two-year period since the COVID-19 pandemic started, 52% of the top-quartile Europe Equity funds at the start of 2020 were able to remain in the same category by the end of the same year.  By the end of 2021, over 21% of these same starting funds were still in the top quartile.  This figure is far higher than what would be expected through choosing a fund at random (6.25%).  This short-term persistence was not unique to Europe Equity over this period; across all fund categories, at least 6.25% of funds remained in the top quartile for three consecutive years.

While top-quartile funds may have demonstrated a better chance of repeating their relative success over this most recent period, it seems that may not have necessarily translated to outperformance when compared with their benchmarks.  To avoid the risk of drawing conclusions from a single time period, Report 8 analyzes the persistence of outperformance on average over rolling quarters.  Europe Equity funds that had beaten the benchmark in any rolling three-year window over the period analyzed had a 44.4% probability of outperforming in the subsequent year.  The probability of the same funds outperforming for three consecutive years following their initial success dropped to 7.2%.

Report 5 indicates that there may also have been some predictability when it comes to bottom-quartile funds; the report shows that 62% of Europe Equity funds in the bottom quartile either remained there or ceased to exist over the subsequent five years.  In fact, in all fund categories, fourth-quartile active funds were more likely to remain relatively poor performers, with fewer than 10% able to turn their fortunes around and become first-quartile funds.

pdf-icon PD F Download Full Article

SPIVA Japan Year-End 2022

Contributor Image
Maya Beyhan

Global Head of Sustainability, Index Investment Strategy

S&P Dow Jones Indices

Contributor Image
Joseph Nelesen, Ph.D.

Head of Specialists, Index Investment Strategy

S&P Dow Jones Indices

Contributor Image
Davide Di Gioia

Director, Index Investment Strategy

S&P Dow Jones Indices

Since the first publication of the S&P Indices Versus Active (SPIVA) U.S. Scorecard in 2002, S&P Dow Jones Indices has been the de facto scorekeeper of the ongoing active versus passive debate.

The SPIVA Japan Scorecard measures the performance of actively managed funds offered in Japan against their respective benchmarks over various time horizons, covering large-, mid- and small-cap segments, as well as international and global equity funds.

Year-End 2022 Highlights

More than two-thirds (70%) of All Japanese Equity funds underperformed the broad-based S&P Japan 500 over the full-year 2022 period. In all but one of the remaining categories, well over half of funds underperformed their benchmarks. International Equity funds were the sole exception with an underperformance rate of 42% in 2022.

SPIVA Japan: Exhibit 1

  • The S&P/TOPIX 150 posted -3.42% in 2022, and 68% of Japanese Large-Cap funds underperformed the index over the period. This was the worst underperformance rate reported for the large-cap category since December 2018.
  • Results for active managers were better in the International Equity funds category, where 42% of actively managed funds underperformed the S&P Global 1200 Ex-Japan in 2022 (see Exhibits 6, 7 and 8).
  • For Japanese Mid-/Small-Cap funds, 75% underperformed the S&P Japan MidSmallCap, which declined 0.21% in 2022. However, the long-term record of actively managed Japanese Mid-/Small-Cap funds is relatively better, with 50%, 47% and 52% underperforming over the 3-, 5- and 10-year periods, respectively (see Exhibit 5).
  • All Japanese Equity funds generated a relatively range-bound underperformance rate over all our reported time horizons, with underperformance rates versus the S&P Japan 500 ranging between 70% and 82%. In 2022, the S&P Japan 500 ended the year down 2.93%, and 70% of actively managed funds underperformed (see Exhibit 4).
  • After 80% of U.S. Equity funds underperformed over 2021, actively managed Japanese funds invested in U.S. equities reduced their underperformance rate in 2022, with a slight majority of 53% underperforming the S&P 500®’s loss of 6.17% in Japanese yen terms.
  • The S&P Global 1200 posted -4.80% in 2022, and 71% of Global Equity funds failed to beat the benchmark, in many cases underperforming by wide margins. The average total return of the funds in this category was -12.68% on an equal-weighted basis and -22.17% on an asset-weighted basis.
  • While the S&P Emerging BMI declined 5.76% in 2022, 80% of Emerging Equity funds underperformed. As time horizons extended, the percentage of underperforming funds increased to levels surpassing any other category, with 88%, 91% and 100% failing to beat the benchmark over 3-, 5- and 10-year periods, respectively.
  • Taken all together, the data in this report suggest that among the active funds offered in Japan, International Equity managers were relatively more successful when it came to turning opportunities into positive outcomes, but that despite an abundance of opportunities, active funds in all the other fund categories struggled to take advantage.

pdf-icon PD F Download Full Article

Processing ...