


Summary
As readers of our SPIVA® Scorecards know, active management is challenging. Of all active large-cap U.S. equity funds measured, 79% underperformed the S&P 500® in 2025, worse than the 65% rate observed in 2024 and the fourth-worst year for active large-cap managers over the 25-year history of the SPIVA Scorecards.
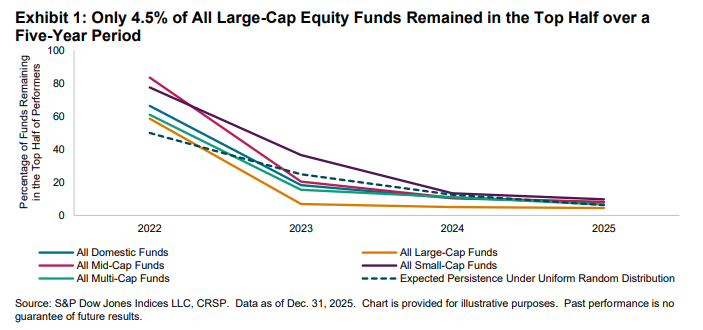
But identifying outstanding managers can be equally, if not more, challenging. The Persistence Scorecard shows that consistent outperformance is typically fleeting. Among top-half funds within all reported active domestic equity categories in calendar year 2021, only a handful of funds remained in the top half over the next four years (see Exhibit 1). For large-cap funds, the results were even less than a random distribution would suggest, evidence that active outperformance, when it occurs, tends to be the result of luck rather than genuine skill.
Report Highlights
Persistence of outperformance, while generally better than in previous years, was fleeting, with a fraction of actively managed equity funds able to maintain consistent outperformance relative to their peers over the three- and five-year periods ending in December 2025.
- 29% of the top-quartile large-cap funds in calendar year 2023 maintained their position in the top quartile for the subsequent two years, higher than the 0% reported in 2024. Of the top-half large-cap funds from 2023, 49% remained in the top half by the end of 2025, roughly double the expected 25% based on random chance (see Report 1).
- However, if we extend the clock two years, results were bleak. With the exception of small-cap funds, none of the top-quartile funds within all reported active domestic equity categories from 2021 remained in the top quartile through 2025. Only 4.5% of the above-median large-cap active equity funds remained persistently above median; if outperformance was purely random, we would expect a rate of 6.25% (see Report 2).
- Results further down the capitalization spectrum were generally similar to their large-cap peers, with improvements on the three-year time horizon compared to the 2024 Persistence Scorecard, but a similar lack of persistent performance over the five-year horizon. Of the top-quartile small-cap funds, 17% maintained their status for the next two years, higher than the 6% reported in 2024, but only 2% of top-quartile small-cap funds remained in the top quartile over a five-year period.
- Looking over non-overlapping five-year periods, if performance were completely random, we would expect 50% of the winners in the first five years to also win in the second five years; if substantially more than 50% of the winners repeated in the second interval, that might be evidence of consistent skill. Results across reported equity categories fell well short of this mark.
- Consistent with their equity counterparts, results for active fixed income managers were generally better over the three-year horizon (see Report 7). Of these, 31% of top-quartile Investment Grade Intermediate funds and 10% of High Yield funds in calendar year 2023 remained in the top quartile in each of the two succeeding years. However, over a five-year period, the percentage of funds remaining in the top quartile was in the single digits across all reported active fixed income categories (see Report 8).
- Performance persisted at the other end of the spectrum. Over consecutive five-year periods, in almost every single reported equity and fixed income category, the worst-performing quartile saw the highest proportion of funds that were subsequently merged or liquidated. For example, 23% of all fourth-quartile domestic U.S. equity funds were merged or liquidated within the subsequent five years; the comparable figure for top-quartile funds was 10% (see Reports 5 and 11).
