IN THIS LIST

ETFs in Insurance General Accounts – 2024

ETFs in Asset Owner Portfolios – Q1 2024

Exploring China A-Share Dividends and High Yield Strategy Performance

The Hare and the Tortoise – Assessing Passive’s Potential in Bonds

Glass-Box Optimization: Bringing Clarity to Sustainability Indices

ETFs in Insurance General Accounts – 2024

Contributor Image
Kelsey Stokes

Sales Head, Insurance

S&P Dow Jones Indices

Contributor Image
Anu R. Ganti

U.S. Head of Index Investment Strategy

S&P Dow Jones Indices

Introduction

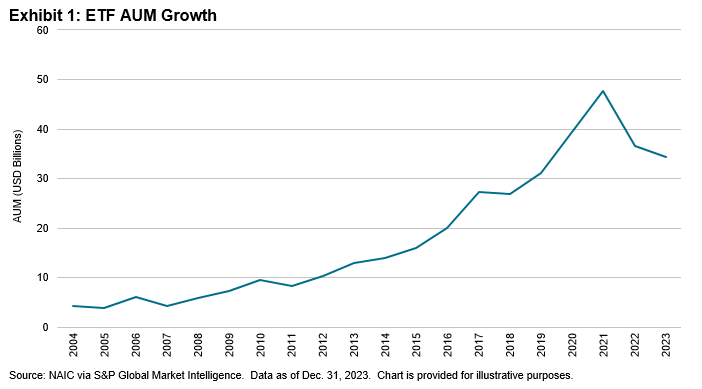
In 2023, U.S. insurers held USD 34.4 billion in exchange-traded funds (ETFs).  For the second year in a row, we saw large outflows from large insurers.  In 2022, the bear market exacerbated the outflows to decrease AUM by 23%.  In 2023, the market acted against the outflows and AUM only decreased by 6%.

One company selling fixed income ETFs accounted for 50% of the outflows.  These outflows accounted for most of the fixed income outflows.  A more diversified set of companies selling equities accounted for the other half of the outflows.  The combined outflows over 2022 and 2023 has altered the profile of ETF holdings by insurers.  In our ninth annual study of ETF usage by U.S. insurance general accounts, we review ETF usage across various types of companies and across different asset classes.  We also analyze how trading patterns have varied over the years.

Holding Analysis

As of year-end 2023, U.S. insurers invested USD 34.4 billion in ETFs.  This is a fraction of the USD 8.1 trillion in U.S. ETF AUM, as well as the USD 8.4 trillion in insurance general account assets.  Exhibit 1 shows the use of ETFs by U.S. insurers over the past 20 years.

ETFs in Insurance General Accounts – 2024 : Exhibit 1

pdf-icon PD F Download Full Article

ETFs in Asset Owner Portfolios – Q1 2024

Contributor Image
Marcus Friedman

Director, Head of Asset Owners Channel

Introduction

For more than a decade, pensions, endowments, foundations and sovereign wealth funds—collectively “asset owners”—have invested in exchange-traded funds (ETFs).  Initially, they invested only minimal amounts.  However, starting in 2017, plans began to slowly increase their ETF usage.  Then, in Q4 2019, these plans suddenly increased their use of ETFs.  The onset of COVID-19 and the resulting financial crisis resulted in asset owners greatly increasing their ETF usage.

In our initial analysis of U.S. and Canadian asset owners, we used 13F filings to analyze ETF holdings and trends in these investments.  In 2023, asset owner ETF AUM increased 22%, to USD 56 billion.  Over the past 10 years, ETF usage has increased 4x, with most of that growth coming in the past three years.  During the same period, the number of asset owners using ETFs nearly doubled and the number of ETFs used increased more than 3.5x.

Holding Analysis

As of year-end 2023, asset owners had USD 56 billion invested in ETFs.  Exhibit 1 shows the growth of ETFs over the past 10 years.  ETF usage began increasing in December 2016.  Then, between Q3 and Q4 2019, ETF AUM doubled.

ETF AUM Growth: Exhibit 1

After peaking at the end of 2021, AUM dropped, mostly on valuation.  However, in 2023, ETF usage again increased, and AUM grew by 22% (see Exhibit 2).  Since 2018, when plans began to use ETFs in a material way, the compound annual growth rate (CAGR) has averaged 28%, implying a doubling of AUM every 2.85 years (see Exhibit 3).

CAGR of ETF AUM: Exhibit 2

pdf-icon PD F Download Full Article

Exploring China A-Share Dividends and High Yield Strategy Performance

Contributor Image
Jason Ye

Director, Factors and Thematics Indices

S&P Dow Jones Indices

Contributor Image
Izzy Wang

Senior Analyst, Factors and Dividends

S&P Dow Jones Indices

Introduction

Dividend indices stand as one of the most recognized factor-based investment strategies. As of year-end 2023, there were 377 dividend-focused exchange-traded products (ETPs) globally, amassing over 500 billion in assets under management (AUM). In the China A-shares market, the dividend strategy surged to prominence as 2024 kicked off, exhibiting robust performance amidst recent market turbulence. With an AUM increase of over CNY 20 billion in 2023, dividends have emerged as the primary factor strategy in China's ETF industry.

This paper undertakes a comprehensive examination of the Chinese dividend market, providing insights into the historical performance of the high dividend yield strategy.

Dividends in the China A-Share Market

Cash dividends may serve as a significant indicator of a company’s future prospects and governance discipline, particularly in developed markets. However, in the China A-shares market, companies have historically displayed reluctance to distribute profits to shareholders, opting instead to retain earnings for reinvestment. Stock dividends once dominated the market, garnering substantial interest from retail investors. This phenomenon underscored a corporate emphasis on refinancing while neglecting the distribution of earnings to shareholders.

In response to the need to enhance shareholder rewards and corporate governance, Chinese authorities introduced a series of dividend encouragement policies.  The China Securities Regulatory Commission (CSRC), for instance, raised the minimum cash dividend payout level to 30% in 2008, compelling companies to distribute profits.  Concurrently, the State Administration of Taxation (SAT) gradually reduced taxes on dividends to encourage public investment in dividend-paying stocks.  The reduction in personal income tax on dividends from 20% to 10% in 2005, further lowered to 5% in 2013 and eventually eliminated in 2015, incentivized investors to hold stocks for more than one year.  In 2023, the CSRC issued a "cash dividend guidance for publicly listed companies," urging clarity in dividend policies and stabilization of investor expectations.  The document also reiterated the importance of a 30% dividend payout ratio, and encouraged companies to start paying interim dividends. These policies played a pivotal role in fostering a cash dividend culture in the China A-share market.

As of Dec. 31, 2023, the trailing 12-month dividend yield of the S&P China A Domestic BMI stood at 1.97%, aligning with the dividend yield level of the S&P Developed BMI and surpassing that of the S&P 500® (see Exhibit 1).  Indexed assets tracking dividend strategies in the China A-shares market surged from CNY 2 billion in 2013 to CNY 42 billion by Dec. 31, 2023, reflecting an impressive annualized compound annual growth rate (CAGR) of 36% (see Exhibit 2).  Moreover, the number of dividend funds tripled over the past four years.

Exploring China A-Share Dividends and High Yield Strategy Performance: Exhibit 1

Exploring China A-Share Dividends and High Yield Strategy Performance: Exhibit 2

pdf-icon PD F Download Full Article

The Hare and the Tortoise – Assessing Passive’s Potential in Bonds

Contributor Image
Anu R. Ganti

U.S. Head of Index Investment Strategy

S&P Dow Jones Indices

Contributor Image
Tim Edwards

Managing Director and Global Head of Index Investment Strategy

S&P Dow Jones Indices

Contributor Image
Agatha Malinowski

Quantitative Analyst, Index Investment Strategy

S&P Dow Jones Indices

“The hare laughed at the tortoise’s feet but the tortoise declared, ‘I will beat you in a race!’” 

Aesop’s Fables, translated by Laura Gibbs (2002)

After the ATM, the index fund has been claimed by some to be the most useful invention the financial sector has ever created.  The relative success of index funds in equities faced a tide of professional skepticism, but they nonetheless became popular.  A similar revolution may be due to occur in the bond markets, where passive investing appears to be climbing a path paved by the equity markets around a decade or so earlier.

A range of practical and theoretical (or even theological) arguments distinguish the potential for indexing in the larger and more granular fixed income markets.  The choice between active and passive exposures is also relatively newer to the fixed income markets, due in part to a historical scarcity of well-known benchmarks and the practical difficulty of tracking them. 

The impact of passive investing on equities since the turn of the century has been such as to fundamentally change an industry.  As the data have accumulated and the range of available products has expanded, and based on a comparison of their trajectories, the stage may now be set for similar developments in professional fixed income management.

This paper explores the practical, theoretical and empirical case for an indexed approach in fixed income, outlining why passive investing came later and examining whether its growth might continue to echo, or even catch up to, that of equity markets.

The Growth of Indexing in Fixed Income

“To win a race, the swiftness of a dart availeth not without a timely start.”

Jean de La Fontaine; The Hare and the Tortoise (1668-1694)

Estimating the aggregated magnitude of passive investing in any given market is difficult, not least because not all market participants report their investment strategy.  The data on a particular subset of passive investment vehicles—namely global mutual funds and exchange-traded funds (ETFs)—are relatively easier to obtain and may offer representative statistics.  Based on this sample, Exhibit 1 compares two measures of passive adoption in equities and fixed income, specifically the percentage of all mutual fund and ETF assets that are managed passively, and the percentage of the total equities and fixed income markets, respectively, that is represented in aggregate by those funds.

The Hare and the Tortoise – Assessing Passive’s Potential in Bonds: Exhibit 1

Exhibit 1 shows that the adoption of index funds in fixed income has lagged that in equities.  This is partly because their story began later: the first equity index funds were created in the early 1970s, but the first passive bond fund was not introduced until 1986. A similar near-decade lag separates the launch of the first ETFs tracking the equity markets in the early 1990s and the 2002 launch of the first fixed income ETFs.

pdf-icon PD F Download Full Article

Glass-Box Optimization: Bringing Clarity to Sustainability Indices

Contributor Image
Leonardo M. Cabrer

Director, Global Research & Design

S&P Dow Jones Indices

Contributor Image
Akash Jain

Director, Global Research & Design

S&P Dow Jones Indices

Abstract

This paper investigates the efficacy of S&P Dow Jones Indices’ (S&P DJI’s) glass-box optimization algorithm for incorporating multiple sustainability-related objectives in the construction of an index.  The glass-box optimization underpins the S&P Paris-Aligned & Climate Transition, Sustainability Enhanced, ESG Enhanced and Net Zero Carbon Budget Indices.  The approach is motivated by the growing demand for transparency in how sustainability, environmental, social and governance (ESG) and other climate-related objectives are incorporated into the index construction process, and an acknowledgement of the multi-faceted nature of these objectives.  The glass-box optimization is compared to a representative risk model-based index optimization in three different scenarios, where each scenario is characterized by a different combination of constraints.  Special emphasis is given to the interpretability and explainability of the optimized index weights, with the motivation to minimize the possibility of greenwashing that may be caused by insufficient association between the optimized index weights and the company characteristics used to define the constraints.  The results provide strong support in favor of the glass-box optimization as a method for building sustainability indices.  The index weights produced by the glass-box optimization are shown to be completely explainable in terms of the constraints, whereas the weights produced by the risk model optimization were strongly influenced by additional factors that are included in the model to explain the covariance matrix of returns.  The indices derived by the glass-box optimization also relied less heavily on extreme positions in small, illiquid assets, while achieving similar levels of performance with respect to realized tracking error and lower portfolio turnover.

Introduction

The past decade has been marked by a significant increase in the proportion of wealth held in passive, index-based investment strategies, with 42.9% of assets held by U.S. mutual funds and ETFs now being managed passively, reflecting a 2.3% annualized increase since 2013. At the same time, the demand for sustainability and net zero emissions-aligned investment solutions has increased substantially.  The growth in demand for ESG and climate-oriented investment strategies has been driven by the search for long-term financial value and the pursuit of investment opportunities that align with global sustainability objectives. This trend shows no sign of slowing, with PricewaterhouseCoopers (2022) reporting that 8 in 10 investors plan to boost their exposure to ESG over the next two years, and that by 2026, nearly USD 34 trillion in global assets will be directed into ESG funds and other sustainability investment vehicles.

The sustainability characteristics of an index can be improved by applying a series of stock-level selection criteria targeted at removing the least sustainable companies (e.g., business activity exclusions and best-in-class constituent selection) or by defining an index weighting scheme that allocates the greatest weight to companies with the most favorable characteristics (e.g., tilting strategies and constrained index optimization techniques).  These steps can be applied individually or together as part of a multi-step methodology.  This paper is principally concerned with the latter.  Specifically, we consider the problem of improving the sustainability characteristics of a global stock market index by optimizing the weights subject to one or more constraints.  This approach is consistent with recent research by Kölbel et al. (2020), who identified capital allocation, shareholder engagement and indirect impacts as the three channels through which sustainability investing contributes to societal goals.  The effectiveness of the capital allocation mechanism relies on a strong link between the reweighting of individual companies and the sustainability data used to construct the index.  Hence, this paper gives special attention to the strength of the relationship between the index weights and the variables used to define the constraints.  Sustainability indices may also serve an important role in their capacity as investment benchmarks—an indirect impact mechanism noted by Kölbel et al. (2020).

pdf-icon PD F Download Full Article

Processing ...