IN THIS LIST

Transitioning S&P Sustainability Indices to S&P Global ESG Scores and Business Involvement Screens

Aligning Index Strategies with the UN Sustainable Development Goals

FAQ: S&P SDG Indices

The Growing S&P 500 ESG Index Liquidity Ecosystem

TalkingPoints: The iBoxx ChinaBond Asian High Yield Index

Transitioning S&P Sustainability Indices to S&P Global ESG Scores and Business Involvement Screens

Contributor Image
Barbara Velado

Senior Analyst, Research & Design ESG Indices

S&P Dow Jones Indices

On Dec. 6, 2023, S&P Dow Jones Indices launched a consultation to propose two key enhancements to its sustainability index offerings.  S&P DJI periodically conducts market consultations to help ensure its indices continue to stay timely and relevant, while reflecting financial markets and the sustainability landscape’s ongoing evolution.

The consultation’s proposed enhancements, which have been adopted as per S&P DJI’s announcement on Jan. 23, 2024, resulted in:

  • Changing from Sustainalytics’ Product Involvement Screens to S&P Global Sustainable1’s (S1’s) Business Involvement Screens (BIS); and
  • Changing from the S&P DJI ESG Scores to S1’s S&P Global ESG Scores.

Here, we explore in more detail the rationale and impact of each of these changes.

S&P Global Business Involvement Screens

BIS are used to help remove companies involved in business activities not aligned with investors’ sustainability goals, such as thermal coal, tobacco and controversial weapons.  While levels of involvement deemed acceptable for index inclusion can differ across investor goals, these and other screens are often considered minimum standards for sustainability-focused investors.

Further strengthening transparency and providing additional granularity around reasons for exclusions drove the transition of S&P DJI’s sustainability indices to the S&P Global BIS dataset.

pdf-icon PD F Download Full Article

Aligning Index Strategies with the UN Sustainable Development Goals

Contributor Image
Stephanie Rowton

Director, Head of Sustainability Indices EMEA

S&P Dow Jones Indices

Since its introduction several years ago, environmental, social and governance (ESG) investing has evolved to measure risk, materiality and other exogeneous factors to help investors align portfolios with broader sustainability- and society-related objectives.

However, since the United Nations (UN) introduced its framework for sustainability and development, some of the business community has also looked to integrate an alternative approach.  By aligning investments with the UN Sustainable Development Goals (SDGs), market participants can assess how their investments influence environmental sustainability, economic sustainability and inclusive societies.

Incorporating an approach within index-based strategies that aligns with the UN SDGs could dramatically expand the opportunities to deploy capital toward specific societal and sustainability-focused objectives.

This paper explains the role SDGs can play in building effective, transparent and consistent indices that align with society’s broader objectives, as measured by the SDGs.  The paper also examines best practices for gathering and incorporating data that measure a company’s alignment with SDGs across its revenue sources and operations.

An Alternative to ESG Investing

ESG investing often involves a risk-based scoring system that starts with assessing the financial materiality of ESG factors for an industry or specific company.  Factors include those that may have a present or future impact on a company’s value drivers, earnings capacity, competitive positioning or long-term value for its shareholders, and if those factors have a significant impact on society or the environment.

A different approach is to identify the measurable and specific impacts that a company’s activities make on society and the environment, regardless of the financial materiality implications.

One way to implement this type of investing is to employ a framework that aligns with the UN SDGs.

pdf-icon PD F Download Full Article

FAQ: S&P SDG Indices

Company Background

  1. Who is S&P Dow Jones Indices? S&P Dow Jones Indices (S&P DJI) is the largest global resource for essential index-based concepts, data and research, and it is home to iconic financial market indicators, such as the S&P 500® and the Dow Jones Industrial Average®. More assets are invested in products based on our indices than products based on indices from any other provider in the world. Since Charles Dow invented the first index in 1884, S&P DJI has been innovating and developing indices across the spectrum of asset classes, helping to define the way investors measure and trade the markets.
  2. Who is S&P Global Sustainable1?  S&P Global Sustainable1 serves as the central source for sustainability intelligence from S&P Global. Through the use of S&P Global Trucost’s environmental data, Sustainable1 is a leader in carbon and environmental data and risk analysis and assesses risks relating to climate change, natural resource constraints and broader environmental, social and governance (ESG) factors.

  1. Who is Impact Cubed?  Impact Cubed is a London-based provider of sustainability impact data and analytics. Impact Cubed’s data are based on factual and quantitative analyses that enable the company to assess a security through a range of lenses, including alignment with the United Nations Sustainable Development Goals (SDGs).
  2. Why did S&P DJI choose Impact Cubed for an SDG index?  The chosen dataset encapsulates a holistic framework of issuer-level data that offers 3.5 times the granularity of other data providers. This means identifying positive and negative real-world outcomes related to investees’ operations, products and services. This in turn enables an understanding of what a company does, where it does it and how it aligns with the SDGs, considering geolocation.
  3. How does Impact Cubed assess alignment to the SDGs?  There are two approaches in the methodology used to assess SDG alignment: revenue and operational. These approaches are translated into three different datasets.
    1. Revenue is based on what a company makes (its products and services) and uses company-disclosed revenues, which are mapped to one of the products and services in Impact Cubed’s industry classification framework. Each business activity is classified as positively aligned, neutral or negatively aligned to one or more SDGs.
    2. Operational is based on a company’s operations (how the products and services are made) and uses various operational ESG factors from Impact Cubed's corporate factor model. Each factor is mapped to one or more SDGs.
    3. Both approaches are combined to provide a holistic view of SDG alignment based on what a company makes as well as its operations.

pdf-icon PD F Download Full Article

The Growing S&P 500 ESG Index Liquidity Ecosystem

Contributor Image
Aran Spivey

Senior Analyst, Sustainability Indices

S&P Dow Jones Indices

Contributor Image
Michael Orzano

Head of Global Exchanges Product Management

S&P Dow Jones Indices

Contributor Image
Igor Zilberman

Senior Lead, Capital Market Investment Strategy

S&P Dow Jones Indices

Introduction

Since its launch in 2019, the S&P 500 ESG Index has emerged as an important benchmark in providing a sustainable alternative to the S&P 500.  While assets under management (AUM) based on the index have grown steadily (see Exhibit 1), the S&P 500 ESG Index is also notable for the liquidity associated with the growing network of financial products based on it.  Though dwarfed by the massive scale of the S&P 500, the trading volumes based on the ecosystem of exchange traded funds (ETFs), futures and options surrounding the S&P 500 ESG Index are unmatched by other offerings in the market, bolstering the index’s position as the most liquid sustainability index for U.S. equities.

The Growing S&P 500® ESG Index Liquidity Ecosystem: Exhibit 1

About the Index

As of Sept. 29, 2023, the S&P 500 ESG Index included 319 companies from the S&P 500.  The S&P 500 ESG Index seeks to reflect many of the attributes of the S&P 500 itself, while providing an improved sustainability profile.  This outcome is achieved by applying various sustainability exclusions and using S&P DJI ESG scores to target 75% of the market capitalization in each S&P 500 GICS® industry group.  The index construction process is outlined in Exhibit 2.

The Growing S&P 500® ESG Index Liquidity Ecosystem: Exhibit 2

pdf-icon PD F Download Full Article

TalkingPoints: The iBoxx ChinaBond Asian High Yield Index

Contributor Image
Kangwei Yang

Director, Fixed Income Indices

S&P Dow Jones Indices

The iBoxx ChinaBond Asian High Yield is designed to reflect the performance of high yield bonds from Asian issuers, denominated in USD, CNY and SGD. This index is a joint initiative between S&P Dow Jones Indices (S&P DJI) and ChinaBond Pricing Center Co., Ltd. (CBPC). The index seeks to combine the bond valuation data and domestic market expertise of CBPC with S&P DJI’s award-winning global fixed income index expertise that provides investors with accurate and objective indices to assess the performance of the respective underlying markets and investments.

1. Why was the iBoxx ChinaBond Asian High Yield launched?

S&P DJI: Historically, the Asian high yield market has been mostly dedicated to the U.S. dollar (USD) space, where Real Estate bonds from Chinese issuers made up close to half of the market prior to the beginning of China’s Real Estate shift in 2021. Since then, the aggregate market size of Asian USD high yield bonds has declined significantly, as represented by iBoxx USD Asia ex-Japan High Yield 1+ (see Exhibit 1). The declining market size presents challenges for Asian high yield fund managers, including the ability to continue to allocate and find liquidity in the remaining Asian high yield bonds in the index.

At the same time, Asian local currencies have continued to gather interest from investors as a diversifier from traditional hard currency exposures. Asian local currency bond markets, as a whole, have also grown in size and depth over the past few years. These factors drove us to evaluate the accessible local currency bond markets with significant high yield exposure, and as a result, we partnered with CBPC to develop the iBoxx ChinaBond Asian High Yield, which tracks Asian-issued USD, CNY and SGD bonds. As seen in Exhibit 1, with the inclusion of Asian local currency bonds, the iBoxx ChinaBond Asian High Yield consistently provided a larger market size (capacity) compared to the iBoxx USD Asia ex-Japan 1+ from Dec. 31, 2020, to Sept. 30, 2023.

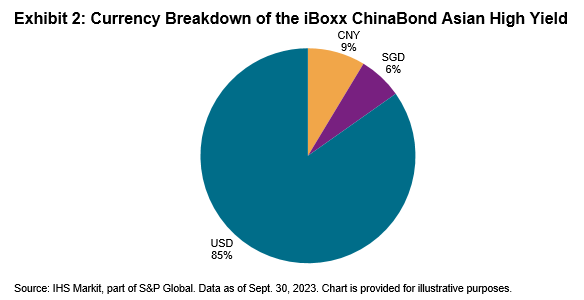
The goal of this index is to provide a measure for investable high yield bonds in the Asian market beyond USD-denominated bonds, as well as to give a broader perspective of the Asian high yield space as local bond markets continue to develop in the years to come. Exhibit 2 shows the breakdown of bonds in the index by currency, as of Sept. 30, 2023.
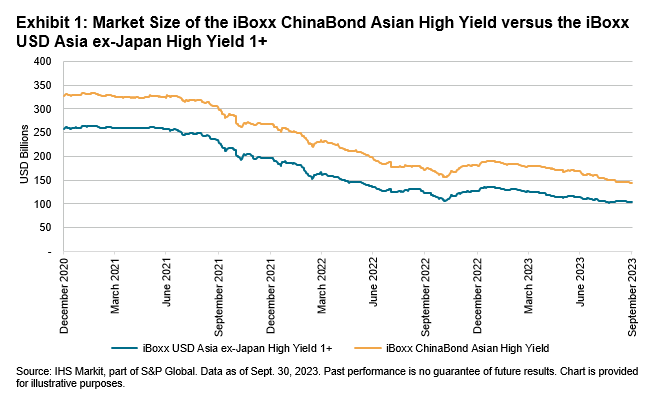
TalkingPoints: The iBoxx ChinaBond Asian High Yield Index: Exhibit 1

TalkingPoints: The iBoxx ChinaBond Asian High Yield Index: Exhibit 2

2. What are some of the considerations in the methodology of the iBoxx ChinaBond Asian High Yield?

S&P DJI: When we designed the index, the intention was to produce a view of the Asian high yield market that investors were familiar with (i.e., USD bonds), yet, at the same time, expand that view to introduce elements of local currency exposure to broaden the index universe.

As a result, from an index methodology perspective, we have implemented an overall issuer cap of 2%. Additionally, non-USD issuers are subject to a cap of 0.5% of the overall index. This approach seeks to address three concerns. First, it aims to minimize accessibility issues to local currency bonds for investors who might be concerned about liquidity. Second, for index funds, this rule allows investors to gradually become accustomed to local currency bond markets without a need to purchase large amounts of local currency bond exposure instantaneously. Third, this serves to provide greater diversification across issuers in the index.

Determining which local markets would be eligible for inclusion into the index was another consideration. From that perspective, we looked at the general liquidity, accessibility and size of the local markets, especially those with larger high yield issuances. As a result, we have had CNY and SGD local markets represented in the index from the onset. In the long term, the aim is to periodically review the eligibility of other Asian local currency markets as regional bond markets continue to grow.

pdf-icon PD F Download Full Article

Processing ...