SUMMARY
The S&P 500® finished 2022 with a -18% total return, its worst performance since 2008, and fixed income markets offered little diversification benefit: the iBoxx $ Liquid Investment Grade also fell 18%. Both asset classes suffered as yields rose in response to a surge in domestic inflation, accompanied by an aggressive series of rate hikes by the U.S. Federal Reserve
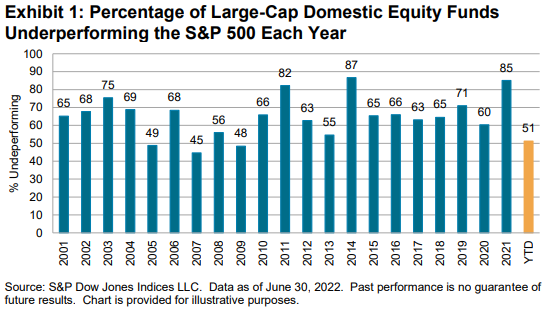
Declining markets can make active management skill more valuable, and our 2022 scorecard identifies several fund categories in which a majority of active managers outperformed. However, in the largest and most closely watched category, U.S. large-cap equities, a slim majority underperformed. On the positive side, this was the lowest underperformance rate since 2009 and the fourth best across more than two decades of our annual SPIVA Scorecards. Less positively, 2022 was characterized by several specific and unusual active tailwinds that may not persist.

In contrast to the near coin-flip chances of finding an outperforming large-cap manager, 63% of mid-cap funds underperformed the S&P MidCap 400® and 57% of small-cap funds underperformed the S&P SmallCap 600® in 2022. The lowest underperformance rate among domestic equity categories was in Small-Cap Core, in which 40% of active funds underperformed. At the other end of the spectrum, the Real Estate and Mid-Cap Growth categories saw the highest annual underperformance rates of 88% and 91%, respectively.
In international equities, a majority of actively managed funds underperformed in every category during 2022. However, in relative terms, managers in the International Small-Cap category continued to outshine their peers, with just 60% underperforming in 2022 compared to 69%, 68% and 76%, in the Global, International and Emerging Markets categories, respectively.
The 2022 completion of the merger between IHS Markit and S&P Global brought a new range of fixed income indices to the S&P DJI family and—as introduced in our most recent mid-year scorecard—the 2022 edition of our year-end U.S. scorecard presents a new range of fixed income comparison indices as well as several new fixed income categories.
The performance of actively managed fixed income funds was generally more creditable in 2022, with just 6% of Core Plus Bond funds and 21% of General Investment Grade funds underperforming. However, we report majority underperformance in 11 out of 17 fixed income categories, topping out at 95% for actively managed Government Intermediate funds.
Echoing a frequent theme of SPIVA Scorecards over the past 20 years, underperformance rates generally rose with the length of the period over which they were measured. Of 39 reported categories, eight displayed majority outperformance over a one-year horizon, falling to just two categories over a five-year horizon.


