


After a tumultuous fourth quarter in 2018, the S&P 500® rebounded in the first half of 2019 to return 18.5%—the best performance for the first half of a year since 1997. The S&P MidCap 400® (18.0%) and the S&P SmallCap 600® (13.7%) also posted double-digit gains. For the 12-month period ending in June, the S&P 500 and the S&P Composite 1500® were up 10.4% and 9.3%, respectively. Over the same period, the S&P MidCap 400 gained a modest 1.4% while the S&P SmallCap 600 fell 4.9%. This performance divergence highlights the dominance of large-cap securities in driving the recent market performance. Cyclical sectors such as Information Technology (27.1%) and Consumer Discretionary (21.8%) led the charge in the first half of 2019, while Health Care (8.1%) and Energy (13.1%) lagged.
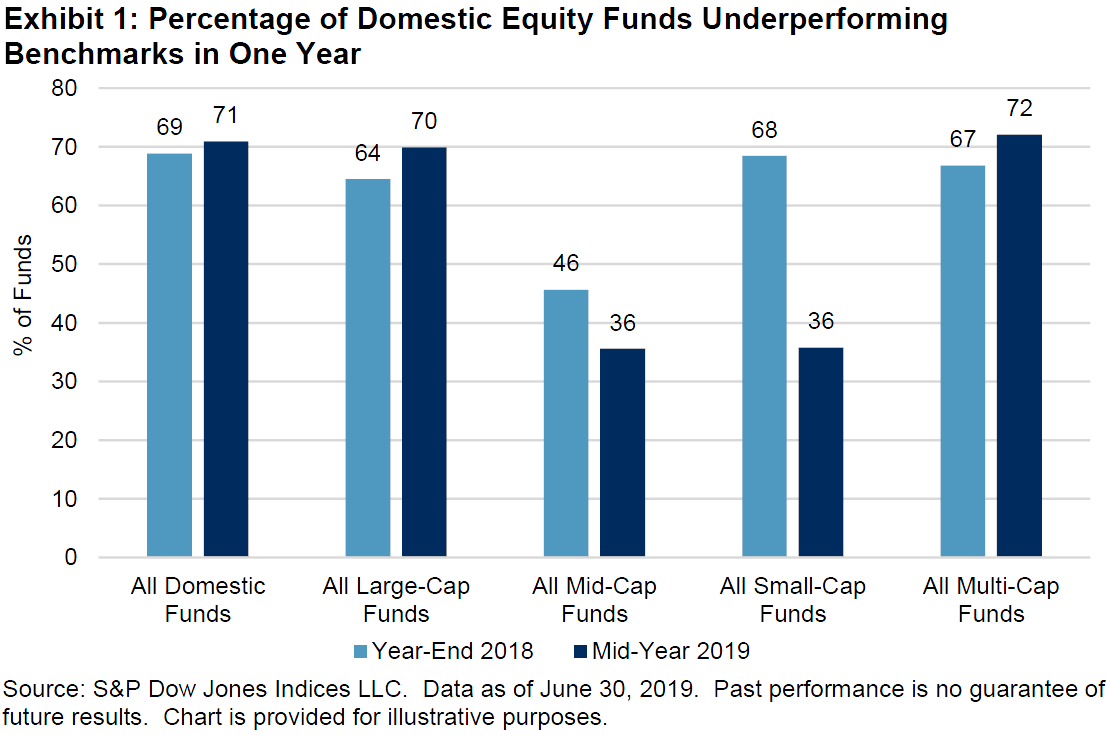
For the one-year period ending in June 2019, 71% of domestic equity funds underperformed the S&P Composite 1500, slightly more than the previous report’s 69%. Additionally, the majority of large-cap (70%) and multi-cap (72%) funds lagged their benchmarks. In contrast, mid-cap and small-cap active funds performed relatively better; approximately 64% of active managers in both categories beat their benchmarks for the one-year period.
Growth-style investing led the recovery in the first half of 2019, which led to growth outpacing value for the last 12 months. However, most domestic large-cap growth managers were unable to keep up with the performance of the S&P 500 Growth (12%) for the one-year period ending in June. In fact, compared with results from six months prior, a higher percentage of large-cap growth funds underperformed (going from 60% to 70%) by an equal-weighted average of 1.5%.
Unlike their large-cap counterparts, most mid- and small-cap growth managers found success; 88% of mid-cap growth managers beat the S&P MidCap 400 Growth (up 1.9%) and 85% of small-cap growth managers beat the S&P SmallCap 600 Growth (down 2.3%) for the one-year period ending in June 2019. The magnitude of outperformance was significant, as the equal-weighted average one-year returns of the mid- and small-cap growth categories were 11.5% and 5.3%, respectively—an excess of 9.6% and 7.6% relative to their respective category benchmarks. Fund size was not a factor, as results were similar using asset-weighted returns for each category. The outsized success of growth managers in the two smaller-cap categories and the divergence in returns observed across the size segments for the last year point to potential “size creep” into large-cap securities by those managers in order to boost returns.
Over longer-term horizons (10 and 15 years), at least 80% of active managers underperformed their respective benchmarks across all domestic equity categories.
The S&P 700, a barometer for international equities, rose over 14% in the first six months of 2019, despite continued trade tensions involving major world economies (U.S. and China, Brexit). The strong market returns did not translate to success for international equity managers, as the majority of international and emerging market funds in all categories underperformed their benchmarks for the one-year period ending in June 2019—72% of international funds lagged the S&P 700 and 55% of emerging market managers failed to beat the S&P/IFCI Composite.
For the first time since 2007, the U.S. yield curve inverted in March, as measured by the relative yields of the 3-month Treasury bill and 10-year Treasury bond. While the Fed refrained from cutting its target rate in the first half of 2019, the June meeting minutes showed increased concern for the U.S. economic outlook. Unsurprisingly, the minutes bolstered expectations for rate cuts in the second half of the year. The majority of fixed income active funds underperformed their benchmarks, with global income funds (at 44%) the lone exception. Of particular note, all government long funds and loan participation funds underperformed their respective benchmarks over the one-year horizon. This is in stark contrast to results from the report six months prior, when just 17% of government long funds and 57% of loan participation funds underperformed.
In the government and investment-grade fund categories, short- and intermediate-term funds did relatively better than those focused on the long end of the curve. The longer-term, 15-year figures show that most active fixed income managers underperformed their benchmarks.
Survival rates of funds remained low across all categories; 57% of domestic equity funds, 49% of international equity funds, and 52% of all fixed income funds were merged or liquidated over the 15-year horizon.
