Summary
The semiannual SPIVA Europe Scorecard was first published in 2014 and reports on the performance of actively managed funds domiciled across Europe. In this report, we complement the traditional scorecard with a comparison of sustainability-focused actively managed funds and indices. In addition to performance, we also assess changes in the sustainability profile relative to the broad equity benchmarks and tracking error characteristics.
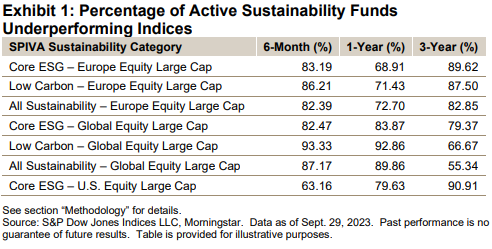
In the six-month period ending on Sept. 29, 2023, more than 80% of active sustainability funds underperformed their assigned benchmarks in most categories. Over the three-year horizon, 91% of active funds in the Core ESG – U.S. Equity Large Cap category underperformed the S&P 500® ESG Index (see Exhibit 1).

Introduction
Asset owners around the globe have been increasing their allocations to investment strategies that incorporate sustainability considerations. This increase, in turn, reflects the growing importance of sustainability factors for asset managers in their investment decisions. In the meantime, the regulatory landscape has been maturing and becoming more far-reaching, while a growing number of asset owners and asset managers have been voluntarily committing to sustainable investing practices.
Sustainability-focused active funds and indices typically have investment objectives aimed at improving their sustainability profile relative to their underlying broad equity benchmark. For example, if one of the investment objectives is to reduce carbon emissions, an active fund or index may tilt toward less carbon-intensive companies or even exclude some of the largest emitters. This positioning, in turn, results in tracking error relative to the benchmark. The trade-off between achieving an improved sustainability profile and maintaining the desired broad equity benchmark-like performance characteristics requires a delicate balance.
In terms of sustainability profile, this report examines two metrics:
- Index-weighted Carbon Intensity; and
- Temperature Alignment, which is a forward-looking metric assessing a company's future projected decarbonization trajectory. Together, these two metrics measure carbon reductions realized at a given point in time, as well as assess alignment with climate scenarios from a forward-looking perspective.
There are different approaches to measuring and analyzing a fund’s sustainability performance. The advantage of these two metrics is their relative robustness and quantifiable nature.
The purpose of this report is to provide asset owners and asset managers with research insights to help them prioritize and make decisions regarding sustainable investing strategies by finding the "sweet spot" between their tracking error tolerance and sustainability objectives in the most cost-efficient way.


