


S&P Dow Jones Indices has been the de facto scorekeeper of the ongoing active versus passive debate since the first publication of the S&P Indices Versus Active (SPIVA) U.S. Scorecard in 2002.
The SPIVA South Africa Scorecard measures the performance of actively managed South African equity, global equity and fixed income funds denominated in South African rand (ZAR) against their respective benchmark indices over various time horizons.
Year-End 2024 Highlights
Managers of South Africa Equity funds faced a relatively favorable year in 2024, posting majority outperformance rates against both the S&P South Africa 50 and S&P South Africa Domestic Shareholder Weighted (DSW) Capped Index. In comparison, those with a global mandate continued to experience particularly challenging conditions, with 93% of managers failing to outperform the S&P World Index over the course of the year. Exhibit 1 presents a summary of results across all categories.
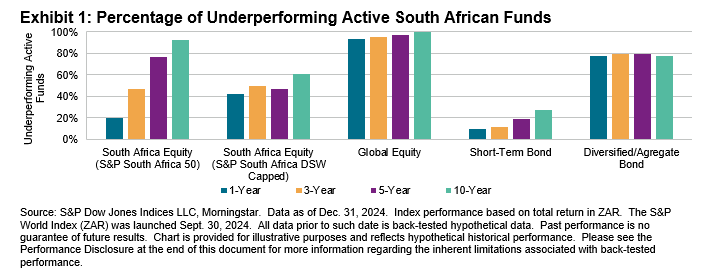
- South Africa Equity: The S&P South Africa 50 rose 10.9% in 2024. Over the same period, South Africa Equity funds posted a gain of 14.9% on an asset-weighted basis and a category underperformance rate of 19.9%. Over longer horizons, underperformance rates rose to 47.2%, 76.2% and 92.2% for the 3-, 5- and 10-year periods, respectively. When measured against the S&P South Africa DSW Capped Index, which increased 13.3% over the year, a much higher proportion of funds underperformed (41.8%). Over the 3- and 5-year periods, underperformance remained near this level at 49.2% and 46.6%, respectively, ultimately increasing to 60.8% over the 10-year period.
- Global Equity: The S&P World Index posted a strong gain of 23.3% over 2024, outpacing the 15.6% asset-weighted average return of Global Equity funds. Of the funds in this category, 93.4% underperformed—nearly 10 percentage points higher than in 2023.0F Underperformance rates increased steadily over time, reaching a full 100% over 10 years.
- Short-Term Bond: Over 2024, the STeFI Composite recorded an increase of 8.4%, while managers of Short-Term Bond funds achieved returns of 10.1% on an asset-weighted basis. In terms of underperformance, Short-Term Bond managers achieved the best result across categories for the year, with only 9.7% of funds underperforming. Over longer periods, the majority of managers were successful in continuing this trend, posting underperformance rates of 11.9%, 18.5% and 27.7% over 3-, 5- and 10-year periods, respectively.
- Diversified/Aggregate Bond: The S&P South Africa Sovereign Bond 1+ Year Index increased 17.3% in 2024. Over the same period, Diversified/Aggregate Bond funds posted gains of 13.3% and 12.3% on asset-weighted and equal-weighted bases, respectively, with 77.7% of funds ultimately underperforming the index. Over the long term, underperformance rates remained fairly consistent at 79.1% for both 3- and 5-year periods, and a marginally lower 77.9% over the 10-year period.
- Fund Survivorship: For the one-year period ending Dec. 31, 2024, merger/liquidation rates across all categories did not exceed 5.0%. As in 2023,1 the Short-Term Bond category saw the highest attrition rate at 4.8%. Over longer periods, South Africa Equity funds experienced the most significant thinning of the herd, with merger and liquidation rates of 11.6%, 22.8% and 41.0% over the 3-, 5- and 10-year periods, respectively. Across all categories, 34.6% of funds failed to survive over the 10-year period.
