IN THIS LIST

SPIVA South Africa Year-End 2022

SPIVA Canada Year-End 2022

SPIVA® Australia Year-End 2022

SPIVA U.S. Year-End 2022

Latin America Persistence Scorecard Mid-Year 2022

SPIVA South Africa Year-End 2022

Contributor Image
Joseph Nelesen, Ph.D.

Head of Specialists, Index Investment Strategy

S&P Dow Jones Indices

Contributor Image
Maya Beyhan

Senior Director, ESG Specialist, Index Investment Strategy

S&P Dow Jones Indices

Contributor Image
Davide Di Gioia

Director, Index Investment Strategy

S&P Dow Jones Indices

S&P Dow Jones Indices has been the de facto scorekeeper of the ongoing active versus passive debate since the first publication of the S&P Indices Versus Active (SPIVA) U.S. Scorecard in 2002. 

The SPIVA South Africa Scorecard measures the performance of actively managed South African equity, global equity and fixed income funds denominated in South African rand (ZAR) against their respective benchmark indices over various time horizons.

Summary

Uncertainty plagued global markets in 2022, creating conditions that allowed some active managers to thrive and others to struggle.  Among active South African funds, 61% underperformed the large-cap benchmark, while 48% underperformed the broad market.  Underperformance rates were lower in the Short-Term Bond (10%) and Diversified/Aggregate Bond (24%) categories, while 69% of managers underperformed in the Global Equity category (see Exhibit 1 and Report 1).  Underperformance rates generally increased with measurement horizons, with a cross-category average of 67% of active funds underperforming over the past 10 years.

SPIVA South Africa: Exhibit 1

pdf-icon PD F Download Full Article

SPIVA Canada Year-End 2022

Contributor Image
Anu R. Ganti

U.S. Head of Index Investment Strategy

S&P Dow Jones Indices

Contributor Image
Tim Edwards

Managing Director and Global Head of Index Investment Strategy

S&P Dow Jones Indices

Contributor Image
Joseph Nelesen, Ph.D.

Head of Specialists, Index Investment Strategy

S&P Dow Jones Indices

Contributor Image
Davide Di Gioia

Director, Index Investment Strategy

S&P Dow Jones Indices

Since the first publication of the S&P Indices Versus Active Funds (SPIVA) U.S. Scorecard in 2002, S&P Dow Jones Indices has been the de facto scorekeeper of the ongoing active versus passive debate.

The SPIVA Canada Scorecard measures the performance of Canadian actively managed funds against their respective benchmarks over various time horizons, covering large-, mid- and small-cap segments, as well as international and global equity funds.

Year-End 2022 Highlights

2022 was a relatively less challenging year for most actively managed funds in Canada. A little over one-half of active funds underperformed their benchmarks in several categories, including Canadian Equity at 52%, Canadian Focused Equity at 63%, U.S. Equity at 58% and Global Equity at 54% (see Exhibit 1 and Report 1). Canadian Dividend & Income Equity funds posted the lowest one-year underperformance, with just 42% lagging the benchmark. Underperformance rates generally increased with time horizons.

SPIVA Canada Year-End 2022: Exhibit 1

  • Canadian Equity Funds: The S&P/TSX Composite Index fell 5.8% in 2022, while Canadian Equity funds dropped 5.8% and 5.5% on equal- and asset-weighted bases, respectively. Underperformance rates hit 52% for the one-year period, climbing to 84%, 93% and 85% over the 3-, 5- and 10-year horizons, respectively.
  • Canadian Focused Equity Funds: The blended benchmark of 50% S&P/TSX Composite Index + 25% S&P 500® + 25% S&P EPAC LargeMidCap fell 8.2% in 2022, outperforming 63% of Canadian Focused Equity funds. This rose to 71%, 92% and 96% over the 3-, 5- and 10-year horizons, respectively.
  • Canadian Dividend & Income Equity Funds: The S&P/TSX Canadian Dividend Aristocrats® Index fell 3.7% during 2022, while Canadian Dividend & Income Equity funds lost 4.4% and 3.7% on equal- and asset-weighted bases, respectively. Underperformance rates reached 42% over the one-year period, rising to 57%, 88% and 72% over the 3-, 5- and 10-year horizons, respectively.
  • Canadian Small-/Mid-Cap Equity Funds: The S&P/TSX Completion Index dipped 4.2% in 2022, and 90% of Canadian Equity Small-Mid-Cap funds underperformed the index. Funds in this category lost 11.5% and 11.4% on equal- and asset-weighted bases, respectively, over the one-year period.
  • U.S. Equity Funds: The S&P 500 shed 12.2% in 2022, and 58% of U.S. Equity funds underperformed the index. Few funds in the U.S. Equity category outperformed over the long term, with 94%, 96% and 98% underperforming over 3-, 5- and 10-year horizons, respectively.
  • International Equity Funds: 69% of International Equity funds trailed the S&P EPAC LargeMidCap, and 84% and 93% underperformed over the 5- and 10-year periods, respectively.
  • Global Equity Funds: The S&P Developed LargeMidCap fell 12.3% in 2022 and Global Equity funds sank 14.7% and 14.4% on equal- and asset-weighted bases, respectively. Over the one-year period, 54% of funds in the category trailed the benchmark.  Over the 3-, 5- and 10-year periods, 93%, 94% and 97% of funds underperformed, respectively.
  • Fund Survivorship: Liquidation rates for all categories were in single digits for the one-year period ending Dec. 30, 2022. Over the 10-year period, 45% of Canadian Equity funds merged or liquidated and 37% of funds disappeared across all categories (see Report 2).

pdf-icon PD F Download Full Article

SPIVA® Australia Year-End 2022

Contributor Image
Benedek Vörös

Director, Index Investment Strategy

S&P Dow Jones Indices

Contributor Image
Tim Edwards

Managing Director and Global Head of Index Investment Strategy

S&P Dow Jones Indices

Contributor Image
Davide Di Gioia

Director, Index Investment Strategy

S&P Dow Jones Indices

The SPIVA Australia Scorecard measures the performance of actively managed Australian funds against their respective benchmarks over various time horizons, covering large-, mid- and small-cap equity funds, real estate funds and bond funds, and providing statistics on outperformance rates, survivorship rates and fund performance dispersion.

Year-End 2022 Highlights

After a promising start in relative terms, actively managed Australian Equity General funds found it harder to stay ahead of the market in the second half of the year, resulting in a full-year underperformance rate of 58% compared with the S&P/ASX 200.  Meanwhile, there were better odds of finding an outperforming active manager in the A-REIT category, while, after several years of generally better performance, roughly three-quarters of funds in the mid- and small-cap equity category lagged in 2022.

SPIVA Australia: Exhibit 1

  • Australian Equity General Funds: Having dropped 9.9% in the first six months of the year, the S&P/ASX 200 rose 9.8% in H2 2022 to close the year down 1%. After a relatively good start to the year, Australian Equity General funds endured a challenging second half, with 78.5% of managers underperforming the benchmark, bringing the full year underperformance rate to 57.6%.  Over the longer term, underperformance rates were even higher, with 81.2%, 78.2% and 83.6% of funds underperforming the S&P/ASX 200 over the 5-, 10- and 15-year horizons, respectively.
  • Australian Equity Mid- and Small-Cap Funds: The S&P/ASX Mid-Small rallied 10.1% in the second half of 2022 to close the year down 12.2%. Just 23.4% of Australian Equity Mid- and Small-Cap funds beat the index in 2022, while over 80% underperformed on a risk-adjusted basis.  Funds in this category lost 19.8% and 22.0% on equal- and asset-weighted bases, respectively, for the same period.  The longer-term record within the small- and mid-cap category was relatively stronger, with just 54.7% underperforming over the 15-year period.
  • International Equity General Funds: International equity funds posted -13.9% and -13.2% on equal- and asset-weighted bases in 2022, with 56.3% of funds failing to keep up with the S&P Developed Ex-Australia LargeMidCap in 2022. Over the 5- and 10-year periods, more than 86% and 95% of funds underperformed, respectively.
  • Australian Bond Funds: The S&P/ASX Australian Fixed Interest 0+ Index slumped 10.1% in 2022, with 69.2% of funds in the Australian Bonds category underperforming the benchmark. Active funds had a similar record over the longer term: 66.1% and 79.3% underperformed over 5- and 10-year periods, respectively.
  • Australian Equity A-REIT Funds: Active managers in the Australian Equity A-REIT category posted their lowest underperformance rate since the launch of the SPIVA Australia Scorecard in 2013, with just 41.2% of funds underperforming the benchmark. Active managers’ outperformance came in one of the toughest years for the segment in recent memory: the S&P/ASX 200 A-REIT dropped 20%, its worst annual performance since 2008.  Underperformance rates rose over longer time frames, reaching 79.1% over the 15-year horizon.
  • Fund Survivorship: Liquidation rates for most active fund categories were moderate over the one-year period ending Dec. 30, 2022. Australian Equity General funds recorded the highest liquidation rate, at 7.4%.  In contrast, only 2.0% of Australian Equity A-REIT funds failed to survive.  Over the longer term, survivorship rates were significantly lower, with over 50% of funds merged or liquidated over a 15-year horizon in all but one reported category (see Report 2).

pdf-icon PD F Download Full Article

SPIVA U.S. Year-End 2022

Contributor Image
Tim Edwards

Managing Director and Global Head of Index Investment Strategy

S&P Dow Jones Indices

Contributor Image
Anu R. Ganti

U.S. Head of Index Investment Strategy

S&P Dow Jones Indices

Contributor Image
Craig Lazzara

Managing Director, Index Investment Strategy

S&P Dow Jones Indices

Contributor Image
Joseph Nelesen, Ph.D.

Head of Specialists, Index Investment Strategy

S&P Dow Jones Indices

Contributor Image
Davide Di Gioia

Director, Index Investment Strategy

S&P Dow Jones Indices

SUMMARY

The S&P 500® finished 2022 with a -18% total return, its worst performance since 2008, and fixed income markets offered little diversification benefit: the iBoxx $ Liquid Investment Grade also fell 18%. Both asset classes suffered as yields rose in response to a surge in domestic inflation, accompanied by an aggressive series of rate hikes by the U.S. Federal Reserve

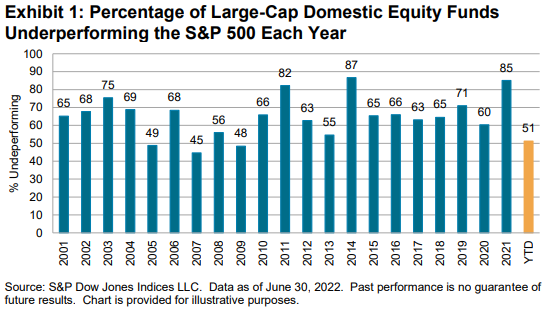
Declining markets can make active management skill more valuable, and our 2022 scorecard identifies several fund categories in which a majority of active managers outperformed. However, in the largest and most closely watched category, U.S. large-cap equities, a slim majority underperformed. On the positive side, this was the lowest underperformance rate since 2009 and the fourth best across more than two decades of our annual SPIVA Scorecards. Less positively, 2022 was characterized by several specific and unusual active tailwinds that may not persist.

SPIVA U.S. Year-End 2022: Exhibit 1

In contrast to the near coin-flip chances of finding an outperforming large-cap manager, 63% of mid-cap funds underperformed the S&P MidCap 400® and 57% of small-cap funds underperformed the S&P SmallCap 600® in 2022. The lowest underperformance rate among domestic equity categories was in Small-Cap Core, in which 40% of active funds underperformed. At the other end of the spectrum, the Real Estate and Mid-Cap Growth categories saw the highest annual underperformance rates of 88% and 91%, respectively.

In international equities, a majority of actively managed funds underperformed in every category during 2022. However, in relative terms, managers in the International Small-Cap category continued to outshine their peers, with just 60% underperforming in 2022 compared to 69%, 68% and 76%, in the Global, International and Emerging Markets categories, respectively.

The 2022 completion of the merger between IHS Markit and S&P Global brought a new range of fixed income indices to the S&P DJI family and—as introduced in our most recent mid-year scorecard—the 2022 edition of our year-end U.S. scorecard presents a new range of fixed income comparison indices as well as several new fixed income categories.

The performance of actively managed fixed income funds was generally more creditable in 2022, with just 6% of Core Plus Bond funds and 21% of General Investment Grade funds underperforming. However, we report majority underperformance in 11 out of 17 fixed income categories, topping out at 95% for actively managed Government Intermediate funds.

Echoing a frequent theme of SPIVA Scorecards over the past 20 years, underperformance rates generally rose with the length of the period over which they were measured. Of 39 reported categories, eight displayed majority outperformance over a one-year horizon, falling to just two categories over a five-year horizon.

SPIVA U.S. Year-End 2022: Exhibit 2

pdf-icon PD F Download Full Article

Latin America Persistence Scorecard Mid-Year 2022

Contributor Image
Anu R. Ganti

U.S. Head of Index Investment Strategy

S&P Dow Jones Indices

Contributor Image
Davide Di Gioia

Director, Index Investment Strategy

S&P Dow Jones Indices

SUMMARY

Can investment results be attributed to skill or luck? Genuine skill is more likely to persist, while luck is random and fleeting. Thus, one measure of skill is the consistency of a fund’s performance relative to its peers. The Persistence Scorecard measures that consistency and shows that, regardless of asset class or style focus, active management outperformance is typically relatively short-lived, with few funds consistently outranking their peers.

In each of our reported regional fund categories across Brazil, Chile and Mexico, of all the funds whose performance placed them in the top quartile for the 12-month period ending June 2018, less than 5% of all funds, and no equity funds, managed to remain in the top quartile for each of the next four years (see Report 2). Exhibit 1 illustrates that across most categories, less than 50% of funds were able to repeat their top-half status over two consecutive five-year periods (see Report 6).

Latin America Persistence Scorecard Mid-Year 2022: Exhibit 1

REPORT HIGHLIGHTS

Brazil

  • Top-performing Brazilian equity fund managers were unable to maintain their outperformance in subsequent years. Equity funds were the least persistent—by the fourth year, none of the funds in the Brazil Equity, Brazil Large-Cap and Brazil Mid-/Small-Cap categories had remained consistently in the top quartile (see Report 2).
  • Bond funds fared slightly better, but still the majority of corporate bond and government bond fund managers did not maintain consistent outperformance for five years in a row; only 3% of them did so (see Report 2).
  • The Brazil Corporate Bond Funds category was a highlight within the five-year transition matrix (see Report 5). The chance of a winning fund remaining in the top quartile after two consecutive five-year periods was the highest among all the categories, with 50% of funds remaining in the first quartile.

Chile

  • The lack of persistence by equity managers was equally visible in Chile—none of the top performing funds in the first 12-month period repeated their outperformance for the subsequent four years (see Report 2).
  • Report 3 shows that only 29% of the top-quartile funds in the first period of the three-year transition matrix remained in the top quartile at the end of the three years.
  • Funds in the second, third and fourth quartiles of the five-year transition matrix were more likely to be liquidated (44%, 44% and 67%, respectively) than to stay where they were or move to a higher-ranked quartile (see Report 5).

Mexico

  • Similar to the other regions, top-quartile managers in Mexico had difficulty replicating their outperformance in subsequent years. After one year, just 27% of managers remained in the top quartile, and after two years, none remained (see Report 2).
  • The five-year transition matrix shows that a third of top-quartile managers moved to quartile four over the five-year period, and only a third remained in the top (see Report 5).
  • Consistent with what we observed in the SPIVA® Latin America Mid-Year 2022 Scorecard, Mexico had a higher fund survival rate than Brazil and Chile across all periods measured. Reports 3, 4, 5 and 6 show that, on average, Mexican funds had less chance of being shut down than Brazilian and Chilean funds.

pdf-icon PD F Download Full Article

Processing ...