


SUMMARY
The S&P Indices Versus Active (SPIVA) Latin America Scorecard compares the performance of actively managed mutual funds in Brazil, Chile, and Mexico to their benchmarks over 1-, 3-, 5-, and 10-year periods.
Markets continued recovering during the first half of 2021. The recovery was accompanied by some inflationary pressures and, in turn, central banks increasing interest rates. Although volatility has dropped from 2020's closing levels, it is still above pre-pandemic levels in the three countries covered in this report. Despite this environment, the majority of active managers across categories failed to outperform, especially over longer periods.
Brazil
- The Brazilian equity market’s upward trend at year-end 2020 extended into the first half of 2021, although a little more moderately, with the S&P Brazil BMI gaining 6.74% YTD and 36.87% over the past 12 months (see Report 3). Large-cap and mid-/small-cap companies also recovered during the first half of 2021, returning 4.29% and 12.36%, respectively, as measured by the S&P Brazil LargeCap and S&P Brazil MidSmallCap. On the other hand, the National Monetary Council reversed the policy interest rates (Selic) trend by increasing it 225 bps, from 2.00% to 4.25%, in the first half of 2021.
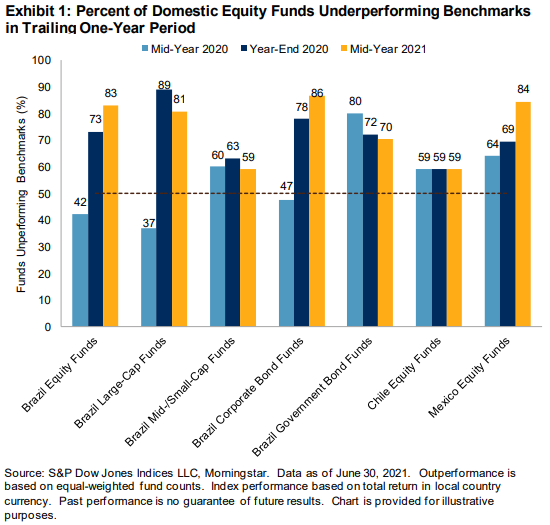
- Over the one-year period, most active fund managers underperformed their benchmarks in all categories: 83.06% of Brazil Equity Funds, 80.80% of Brazil Large-Cap Funds, and 59.09% of the Brazil Mid-/Small-Cap Funds underperformed their benchmarks. In addition, active managers from all categories fared poorly relative to their respective benchmarks over all periods observed, particularly in the mid-/small-cap category, where just 8.70% and 8.33% of managers were able to beat their benchmark over the 5- and 10-year periods, respectively (see Report 1).
- The majority of active bond fund managers underperformed their benchmarks over all the periods observed. Moreover, in this report, we observed the worst survival rate for Brazil Corporate Bond Funds over the 5- and 10-year periods in history, with 25.00% and 29.79% surviving, respectively (see Report 2).
Chile
- The continued 3.83% recovery seen in Chilean equities over the first half of 2021 led to a 9.38% return for the 12-month period ending in June 2021, as measured by the S&P Chile BMI.
- The majority of active equity fund managers underperformed the S&P Chile BMI over all periods studied but especially over the longer time periods, with 92.50% and 97.78% of active funds underperforming the benchmark over the 5- and 10-year periods, respectively (see Report 1). Funds underperformed the benchmark by medians of 1.95% and 2.24% over the 5- and 10-year periods, respectively (see Report 5).
- Smaller funds performed relatively better than larger funds over all observed periods on an equal-weighted basis (see Report 3) versus an asset-weighted basis; the greatest difference was in the 10-year period, at 104 bps, as asset-weighted funds posted 2.84% and equal-weighted funds posted -1.80% (see Report 4).
Mexico
- The S&P/BMV IRT gained 15.46% over the first half of 2021, resulting in a 36.87% return for the past 12 months. The majority of active managers underperformed the S&P/BMV IRT over all periods observed, with the worst result over the 10-year period, with 88.89% of the funds underperforming their benchmark (see Report 1).
- Median fund underperformance was 6.88%, 3.30%, 3.76%, and 2.39% for the 1-, 3-, 5-, and 10-year periods, respectively (see Report 5). Not even managers in the first quartile managed to outperform the benchmark in any period.
- Despite the poor performance of the active managers in the first half of the year, the survival rates of active funds in Mexico were the highest of Latin America, at 100%, 93.62%, 90.70%, and 77.78% over the 1-, 3-, 5-, and 10-year periods, respectively (see Report 2); this marked five scorecards in a row for the three- and five-year periods.
- Smaller funds performed relatively better than larger funds over all observed periods on an equal-weighted basis, especially over the one-year period, with 244 bps of difference (see Report 3).
