IN THIS LIST

SPIVA Japan Year-End 2020

SPIVA India Year-End 2021

SPIVA Latin America Year-End 2020

SPIVA® India Year-End 2020

SPIVA® MENA Year-End 2020

SPIVA Japan Year-End 2020

Contributor Image
Priscilla Luk

Managing Director, Global Research & Design, APAC

S&P Dow Jones Indices

Contributor Image
Tim Wang

Senior Analyst, Global Research & Design

S&P Dow Jones Indices

SUMMARY

  • S&P Dow Jones Indices has been the de facto scorekeeper of the ongoing active versus passive debate since the first publication of the SPIVA U.S. Scorecard in 2002. Over the years, we have built upon our experience by expanding scorecard coverage into Australia, Canada, Europe, India, South Africa, Latin America, the Middle East and North Africa, and Japan.  While this report will not end the debate surrounding active versus passive investing in Japan, we hope to make a meaningful contribution by examining market segments in which one strategy performs better than the other.
  • The SPIVA Japan Scorecard reports on the performance of actively managed Japanese mutual funds against their respective benchmark indices over 1-, 3-, 5-, and 10-year investment horizons.[1] In this scorecard, we evaluated returns of more than 777 Japanese large- and mid/small-cap equity funds, more than 743 international equity funds investing in global, international, and emerging markets, as well as U.S. equities.

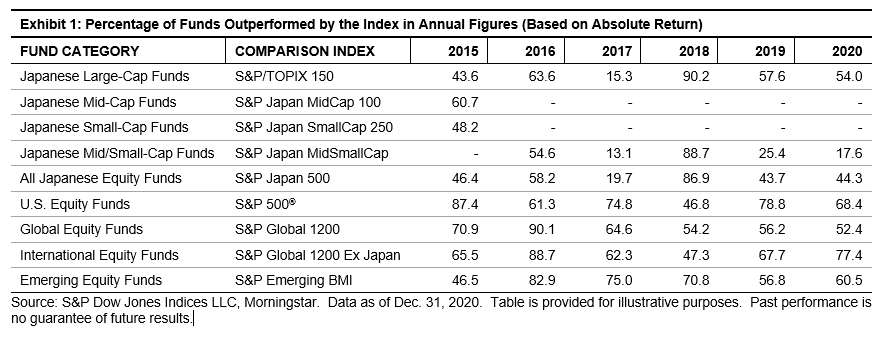
  • Japanese Equity Funds: In 2020, the S&P/TOPIX 150 gained 10.3%, and the S&P Japan MidSmallCap was nearly flat. Over the same period, 46.0% and 82.4% of large- and mid/small-cap equity funds beat their respective benchmarks, with equal-weighted average returns of 10.5% and 13.2%, respectively.  Benchmark-relative performance of domestic equity funds in 2020 was better than in 2019, with higher percentages of funds outperforming the benchmark.

    Over the 10-year horizon, 22.7% and 52.4% of large- and mid/small-cap funds managed to outperform their benchmarks, while 35.0% and 35.7% of funds were liquidated, respectively.  The large-cap funds recorded equal- and asset-weighted average excess returns of 3.2 bps and 4.3 bps relative to benchmark, respectively, while the mid/small-cap funds reported excess returns of 3.86% and 1.85% on equal- and asset-weighted bases, respectively.  Japanese mid/small-cap funds tended to deliver higher benchmark-relative excess return compared with Japanese large-cap funds.

  • International Equity Funds: In 2020, fewer funds in the U.S. and global equity fund categories underperformed their benchmarks than in 2019, while the opposite was observed in the international and emerging market equity fund categories. For U.S. and global equity funds, 68.4% and 52.4% underperformed their respective benchmarks, and 77.4% and 60.5% of international and emerging market equity funds lagged their benchmarks, respectively.  For 2020, global equity funds delivered an equal-weighted excess return of 5.1% versus the S&P Global 1200, while the rest of the foreign equity fund categories reported negative equal-weighted average returns relative to their benchmark indices.  Significant divergence between the asset- and equal-weighted average returns were observed for global equity funds, with asset-weighted return exceeding the equal-weighted returns by 14.1%.

    Over the 10-year period, the majority of foreign equity funds underperformed their respective benchmarks.  More than 90% of global, international, and emerging equity funds underperformed their respective benchmarks, while 78.3% of U.S. equity funds failed to beat the S&P 500®.   However, U.S. equity funds had the worst benchmark-relative excess return on both equal- and asset-weighted bases (-6.1% and -6.0%, respectively).  Foreign equity funds had a 10-year liquidation rate of 46.3%, which was much higher than that of domestic equity funds (35.3%).

SPIVA Japan Year-End 2020: Exhibit 1

pdf-icon PD F Download Full Article

SPIVA India Year-End 2021

Contributor Image
Akash Jain

Director, Global Research & Design

S&P Dow Jones Indices

Contributor Image
Praveen Pandey

Senior Analyst, Global Research & Design

S&P Dow Jones Indices

S&P Dow Jones Indices has been the de facto scorekeeper of the ongoing active versus passive debate since the first publication of the S&P Indices Versus Active Funds (SPIVA) U.S. Scorecard in 2002. Over the years, we have built on our experience publishing the report by expanding scorecard coverage into Australia, Canada, Europe, India, Japan, Latin America, and South Africa.

The SPIVA India Scorecard compares the performance of actively managed Indian mutual funds with their respective benchmark indices over 1-, 3-, 5-, and 10-year investment horizons. In this scorecard, we studied the performance of three categories of actively managed equity funds and two categories of actively managed bond funds over the 1-, 3-, 5-, and 10-year periods ending in June 2021.

The rally in Indian equities continued into the second half of 2021, with more than one-half of the active funds in the large-cap category lagging the S&P BSE 100 benchmark. Active funds in the ELSS and mid-/small-cap categories fared better, with 39.02% and 37.25% of the active funds underperforming their respective benchmarks (see Exhibit 1). 

Mid-/small-cap was the best-performing fund category among the equity categories covered in this scorecard; the S&P BSE 400 MidSmallCap Index’s performance was 51.77% over the one-year period ending in December 2021. Though investors in this category may have witnessed a broad spread in fund returns (the difference in the first and third quartiles was 19.57%), exposing fund selection risk challenges. 

pdf-icon PD F Download Full Article

SPIVA Latin America Year-End 2020

Contributor Image
María Sánchez

Director, Sustainability Index Product Management, U.S. Equity Indices

S&P Dow Jones Indices

SUMMARY

The S&P Indices Versus Active (SPIVA) Latin America Scorecard compares the performance of actively managed mutual funds in Brazil, Chile, and Mexico to their benchmarks over 1-, 3-, 5-, and 10-year periods.

The year 2020 was a volatile one for financial markets.  After a significant sell-off during the first quarter, markets rebounded later in the year.  However, the recovery was marked with uncertainty.  Despite this higher volatility, the majority of active managers failed to outperform, especially over longer periods.  The Chile Equity Fund category did slightly better and active managers were able to beat their benchmark over the one-year period.  However, even this advantage disappeared over longer periods.

Brazil

  • After falling 15.62% the first half of the year, the S&P Brazil BMI gained 26.90% during the second half. The Brazilian equity market finished 2020 up 7.08% (see Report 3). Large- and mid-small-cap companies also recovered during the last six months of 2020, returning 28.99% and 21.39%, respectively, as measured by the S&P Brazil LargeCap and S&P Brazil MidSmallCap. In August 2020, the National Monetary Council cut policy interest rates (Selic) by 25 bps, from 2.25% to 2.00%, and held rates steady for the rest of the year. This helped financial markets rebound during the second half of the year.
  • Over the one-year period, most active fund managers underperformed their benchmarks in all categories: 74.14% of Brazil Equity Fund managers, 88.80% of the Brazil Large-Cap Fund managers, and 63.22% of the Brazil Mid-/Small-Cap Fund managers did not beat their benchmarks. In addition, active managers from all categories fared poorly relative to their respective benchmarks over the 5- and 10-year periods (see Report 1).
  • All categories, except Brazil Government Bond Funds, showed that over the one-year period, larger funds (by assets) performed worse than their smaller peers, especially Brazil Mid-/Small-Cap Funds. However, over the 10-year horizon, larger funds performed better than smaller funds on an equal-weighted basis (see Report 3) versus an asset-weighted basis (see Report 4).

    Chile

    • The 5.34% recovery seen in the Chilean equities market during the latter half of 2020 was not enough to close the year positive. Overall, Chilean equities closed the year down 10.08% over the 12-month period ending in December 2020, as measured by the S&P Chile BMI.
    • The majority of active equity fund managers underperformed the S&P Chile BMI over the 3-, 5-, and 10-year periods, with the median of funds underperforming the benchmark by 1.66%, 2.96%, and 2.60%, respectively (see Report 5). The performance was worse over longer time horizons, with 95.24% and 97.73% of funds underperforming the benchmark over the 5- and 10-year periods, respectively (see Report 1). 
    • • Smaller funds performed relatively better than larger funds over 3-, 5-, and 10-year periods on an equal-weighted basis (see Report 3) versus an asset-weighted basis (see Report 4). Over the one-year period, larger funds performed better by 29 bps.

    Mexico

    • The S&P/BMV IRT gained 18.54% over the second half of 2020. However, the index returned 3.35% for the year. The majority of active managers underperformed the S&P/BMV IRT over all periods observed (see Report 1).
    • Median fund underperformance was 2.63%, 1.73%, 3.13%, and 1.23% for the 1-, 3-, 5-, and 10-year periods, respectively (see Report 5). The highest-performing managers in the category (first quartile) outperformed the S&P/BMV IRT by 112 bps and 107 bps over the one- and three-year periods, respectively. They could not sustain this outperformance for longer periods and underperformed by 26 bps and 15 bps over trailing 5- and 10-year horizons, respectively.
    • The survival rates of Mexico Equity Funds were the highest of Latin America, at 97.96%, 92%, 91.11%, and 75.76%, over the 1-, 3-, 5-, and 10-year periods, respectively (see Report 2).

    pdf-icon PD F Download Full Article

    SPIVA® India Year-End 2020

    Contributor Image
    Akash Jain

    Director, Global Research & Design

    S&P Dow Jones Indices

    S&P Dow Jones Indices has been the de facto scorekeeper of the ongoing active versus passive debate since the first publication of the S&P Indices Versus Active Funds (SPIVA) U.S. Scorecard in 2002. Over the years, we have built on our experience publishing the report by expanding scorecard coverage into Australia, Canada, Europe, India, Japan, Latin America, and South Africa.

    The SPIVA India Scorecard compares the performance of actively managed Indian mutual funds with their respective benchmark indices over 1-, 3-, 5-, and 10-year investment horizons. In this scorecard, we studied the performance of three categories of actively managed equity funds and two categories of actively managed bond funds over the 1-, 3-, 5-, and 10-year periods ending in December 2020.

    The strong rebound that began in early Q2 of calendar year 2020 continued into H2 2020, with the S&P BSE 100 finishing the six-month period up 36.48%. During this recovery period, the majority of the equity active funds in the Indian Equity Large-Cap and ELSS categories lagged their respective benchmarks (see Exhibit 1).

    In the second half of 2020, the asset-weighted returns were lower than their respective benchmark returns in each of the Indian Equity categories: large-cap funds (by 273 bps), ELSS funds (by 318 bps) and mid- and small-cap funds (by 230 bps). 

    pdf-icon PD F Download Full Article

    SPIVA® MENA Year-End 2020

    Contributor Image
    Andrew Innes

    Head of Global Research & Design

    S&P Dow Jones Indices

    Contributor Image
    Andrew Cairns

    Senior Director, Global Research & Design

    S&P Dow Jones Indices

    S&P Dow Jones Indices has been the de facto scorekeeper of the ongoing active versus passive debate since the first publication of the S&P Indices Versus Active Funds (SPIVA) U.S. Scorecard in 2002.  The SPIVA MENA Scorecard measures the performance of actively managed MENA equity funds denominated in local currencies against the performance of their respective S&P DJI benchmark indices over 1-, 3-, 5-, and 10-year investment horizons.

    YEAR-END 2020 HIGHLIGHTS

    The global pandemic of 2020 did not leave the Middle East and North Africa (MENA) economies unscathed.  With oil revenues accounting for a large portion of the GDP of MENA countries, the economic slowdown as a result of the COVID-19 pandemic significantly affected the region.  The impact on benchmark and fund returns, however, was not homogenous across regions.

    MENA

    • Of MENA Equity funds, 68% underperformed the S&P Pan Arab Composite over the one-year period. This number rose to 93% over the 10-year period.
      • The unique market conditions of 2020 did not seem to provide widespread opportunities for active managers across MENA Equity funds. The S&P Pan Arab Composite LargeMidCap Index return was 1.4 percentage points higher than that of MENA Equity funds (on an asset-weighted average basis).  When measured against the broader S&P Pan Arab Composite, this difference increased further to 3.2 percentage points.
      • The outlook for MENA Equity funds was no better when measuring performance on a risk-adjusted basis. Over all time periods, more than 90% of funds underperformed both benchmarks after adjusting for risk.

    GCC

    • Funds focused on the Gulf Cooperation Council (GCC) experienced similar misfortunes, with 58% underperforming the S&P GCC Composite over the one-year period.
      • Further highlighting the struggles of GCC Equity funds, when measured on an asset-weighted basis, the funds trailed the S&P GCC Composite benchmark by 4.8 percentage points over the one-year period. The benchmark outperformance continued over the 10-year period by 0.9 percentage points, annually.
      • Over the three- and five-year periods, 80% and 94% of GCC Equity funds underperformed the benchmark on a risk-adjusted basis, respectively.

    Saudi Arabia

    • Saudi Arabia Equity funds bucked the regional one-year trend, posting the strongest benchmark-relative outperformance of the three categories. For the one-year period, 23% of Saudi Arabia Equity funds underperformed the S&P Saudi Arabia.  This outperformance figure flips the opposite way when the time horizon is extended to 10 years, when 78% of Saudi Arabia Equity funds underperformed the benchmark.
      • Saudi Arabia Equity Funds obtained a remarkable 10.7% asset-weighted average return during 2020, beating the benchmark by 3.9 percentage points.
      • The bottom quartile Saudi Arabia Equity fund posted a return of 10.1% for the one-year period, 3.3 percentage points above the benchmark.

    pdf-icon PD F Download Full Article

    Processing ...