IN THIS LIST

SPIVA Japan Mid-Year 2023

SPIVA MENA Mid-Year 2023

SPIVA Canada Mid-Year 2023

SPIVA India Mid-Year 2023

SPIVA® Europe Mid-Year 2023

SPIVA Japan Mid-Year 2023

Contributor Image
Maya Beyhan

Senior Director, ESG Specialist, Index Investment Strategy

S&P Dow Jones Indices

Contributor Image
Joseph Nelesen, Ph.D.

Head of Specialists, Index Investment Strategy

S&P Dow Jones Indices

Contributor Image
Davide Di Gioia

Director, Index Investment Strategy

S&P Dow Jones Indices

Since the first publication of the S&P Indices Versus Active (SPIVA) U.S. Scorecard in 2002, S&P Dow Jones Indices has been the de facto scorekeeper of the ongoing active versus passive debate.

The SPIVA Japan Scorecard measures the performance of actively managed funds offered in Japan against their respective benchmarks over various time horizons, covering large-, mid- and small-cap segments, as well as international and global equity funds.

Mid-Year 2023 Highlights

It was a challenging first half of 2023 for active management, as over one-half of funds underperformed their benchmarks in all but one of our reported categories.

For domestic Large Cap funds, 91% trailed the S&P/TOPIX 150, while Japanese Mid-/Small-Cap funds were the exception, with an underperformance rate of 48%.

SPIVA Japan: Exhibit 1

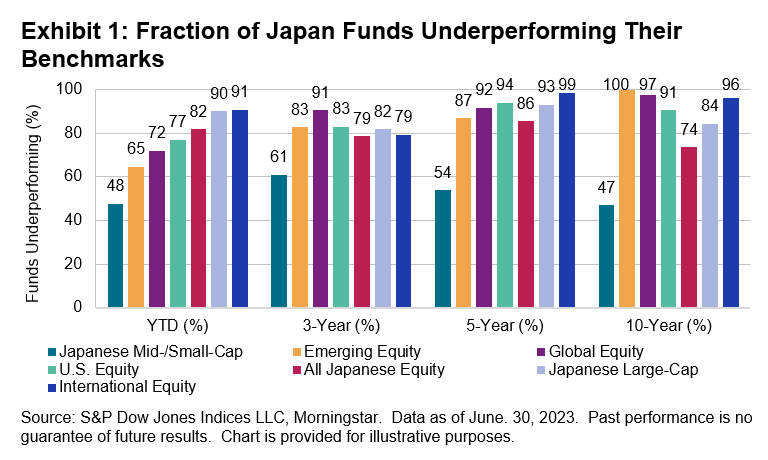
  • The S&P/TOPIX 150 posted 25.5% in the first six months of 2023, and 90% of Japanese Large-Cap funds underperformed the index over the period.
  • International Equity funds, which was the category with the lowest underperformance rate in 2022 (42%), had the highest underperformance rate in the first half of 2023 (91%). At the five-year horizon, 99% of active managers in this category lagged their benchmark.
  • Results for active managers were better in the Japanese Mid-/Small-Cap funds category, where 48% of actively managed funds underperformed the S&P Japan MidSmallCap in the first six months of 2023. These relatively better results were maintained in the long-term record of actively managed Japanese Mid-/Small-Cap funds, with 61%, 54% and 47% underperforming over the 3-, 5- and 10-year periods, respectively.

pdf-icon PD F Download Full Article

SPIVA MENA Mid-Year 2023

Contributor Image
Craig Lazzara

Managing Director, Index Investment Strategy

S&P Dow Jones Indices

Contributor Image
Davide Di Gioia

Director, Index Investment Strategy

S&P Dow Jones Indices

Contributor Image
Grace Stoddart

Quantitative Associate, Index Investment Strategy

S&P Dow Jones Indices

Summary

Since its first publication in the U.S. in 2002, the S&P Indices Versus Active (SPIVA) Scorecard has served as a de facto scorekeeper of the ongoing active versus passive debate.

The SPIVA MENA Scorecard extends this analysis to the Middle East/North Africa region by measuring the performance of actively managed MENA equity funds against their respective benchmarks over various time horizons, providing data on outperformance rates, survivorship rates, and fund performance dispersion.

Mid-Year 2023 Highlights

After falling in 2022, the region’s markets recovered in the first half of 2023.  For example, the S&P Pan Arab Composite, which had declined by 5.7% last year, rose by 5.4%.  This first half of the year was a relatively favorable environment for active management in the region, as only a minority of active managers underperformed.  As Exhibit 1 illustrates, active performance was especially strong in Saudi Arabia, where no managers lagged the benchmark.

SPIVA MENA Mid-Year 2023: Exhibit 1

MENA

  • 22% of MENA equity funds underperformed the S&P Pan Arab Composite in the first six months of 2023, while only 4% underperformed the S&P Pan Arab Composite LargeMidCap Index. (In this period, the largemidcap index gained 2.8% versus 5.4% for the composite, making it an easier target to beat.)  MENA funds averaged returns of 10.2% (equal-weighted) and 11.1% (asset-weighted).
  • As is common in SPIVA analyses, as time periods lengthen, active performance worsens. Despite good recent performance, over the past 10 years, 85% (S&P Pan Arab Composite) and 88% (S&P Pan Arab Composite LargeMidCap Index) of active managers lagged their benchmarks.
  • Perhaps as a result, attrition in this category was relatively high. Only 42% of the MENA funds in our database 10 years ago survive until today.

GCC

  • 22% of GCC equity managers underperformed the S&P GCC Composite in the first six months of 2023. GCC active manager returns averaged 7.9% (equal-weighted) and 11.7% (asset-weighted).
  • As with the MENA group, longer horizons showed worse active results. Over the past 10 years, 72% of GCC managers lagged their benchmark.
  • Despite this, GCC managers’ survival rates were relatively high; 72% of the managers in our database 10 years ago are still active.

Saudi Arabia

  • All the managers in our Saudi Arabian category outperformed the S&P Saudi Arabia index in the first six months of the year. Their returns averaged 22.4% (simple average) and 22.5% (asset-weighted).
  • As with our other categories, time is the active manager’s enemy. After 10 years, 55% of Saudi managers lagged the index.
  • Saudi manager survival rates are comparatively high; 82% of the managers we tracked 10 years ago continue in our database.


SPIVA Canada Mid-Year 2023

Contributor Image
Anu R. Ganti

U.S. Head of Index Investment Strategy

S&P Dow Jones Indices

Contributor Image
Joseph Nelesen, Ph.D.

Head of Specialists, Index Investment Strategy

S&P Dow Jones Indices

Contributor Image
Davide Di Gioia

Director, Index Investment Strategy

S&P Dow Jones Indices

Contributor Image
Grace Stoddart

Quantitative Associate, Index Investment Strategy

S&P Dow Jones Indices

Since the first publication of the S&P Indices Versus Active Funds (SPIVA) U.S. Scorecard in 2002, S&P Dow Jones Indices has been the de facto scorekeeper of the ongoing active versus passive debate.

The SPIVA Canada Scorecard measures the performance of Canadian actively managed funds against their respective benchmarks over various time horizons, covering large-, mid- and small-cap segments, as well as international and global equity funds.

Mid-Year 2023 Highlights

The first half of 2023 was relatively challenging for most actively managed funds in Canada. More than two-thirds of active funds underperformed their benchmarks in several categories, including Canadian Equity funds at 71%, Canadian Focused Equity funds at 78%, U.S. Equity funds at 76% and Global Equity funds at 84% (see Exhibit 1 and Report 1). International Equity funds posted the lowest mid-year underperformance, with 66% lagging the benchmark. Underperformance rates generally increased with time horizons.

SPIVA Canada Mid-Year 2023: Exhibit 1

  • Canadian Equity Funds: The S&P/TSX Composite Index gained 5.7% in H1 2023, while Canadian Equity funds gained 5.1% and 5.4% on equal- and asset-weighted bases, respectively. Underperformance rates hit 71% over six months, climbing to 65%, 95% and 95% over the 3-, 5- and 10-year horizons, respectively.
  • Canadian Focused Equity Funds: The blended benchmark of 50% S&P/TSX Composite Index + 25% S&P 500® + 25% S&P EPAC LargeMidCap gained 8.8% in H1 2023, outperforming 78% of Canadian Focused Equity funds. Underperformance rates were 57%, 89% and 98% over the 3-, 5- and 10-year horizons, respectively.
  • Canadian Dividend & Income Equity Funds: The S&P/TSX Canadian Dividend Aristocrats® Index gained 4.2% during H1 2023, while Canadian Dividend & Income Equity funds gained 3.5% and 2.9% on equal- and asset-weighted bases, respectively. Underperformance rates reached 69% over the six-month period, rising to 90%, 92% and 73% over the 3-, 5- and 10-year horizons, respectively.
  • Canadian Small-/Mid-Cap Equity Funds: The S&P/TSX Completion Index rose 5.6% in H1 2023, and 84% of Canadian Small-/Mid-Cap Equity funds underperformed the index. Funds in this category gained 3.1% and 3.5% on equal- and asset-weighted bases, respectively, over the six-month period.
  • U.S. Equity Funds: The S&P 500 gained 14.2% in H1 2023, and 76% of U.S. Equity funds underperformed the index. Few funds in the U.S. Equity category outperformed over the long term, with 96%, 96% and 95% underperforming over 3-, 5- and 10-year horizons, respectively.
  • International Equity Funds: 66% of International Equity funds trailed the S&P EPAC LargeMidCap in H1 2023, and 84% and 94% underperformed over the 5- and 10-year periods, respectively.
  • Global Equity Funds: The S&P Developed LargeMidCap rose 12.9% in H1 2023 and Global Equity funds gained 9.1% and 7.5% on equal- and asset-weighted bases, respectively. Over the six-month period, 84% of funds in the category trailed the benchmark.  Over the 3-, 5- and 10-year periods, 95%, 96% and 97% of funds underperformed, respectively.
  • Fund Survivorship: Liquidation rates for all categories were in single digits for the six-month period ending June 30, 2023. Over the 10-year period, 47% of Canadian Equity funds merged or liquidated, and 39% of funds disappeared across all categories (see Report 2).

pdf-icon PD F Download Full Article

SPIVA India Mid-Year 2023

Contributor Image
Benedek Vörös

Director, Index Investment Strategy

S&P Dow Jones Indices

Contributor Image
Davide Di Gioia

Director, Index Investment Strategy

S&P Dow Jones Indices

Contributor Image
Grace Stoddart

Quantitative Associate, Index Investment Strategy

S&P Dow Jones Indices

Summary

Since the first publication of the S&P Indices versus Active (SPIVA) U.S. Scorecard in 2002, S&P Dow Jones Indices has been the de facto scorekeeper of the ongoing active versus passive debate.

The SPIVA India Scorecard compares the performance of actively managed Indian equity and bond mutual funds with their respective benchmark indices over 1-, 3-, 5- and 10-year investment horizons.

Mid-Year 2023 Highlights

In the first half of 2023, performance among Indian active managers varied across categories.  The majority of Indian Equity Large-Cap funds failed to beat their benchmark, with 58% of actively managed funds underperforming the S&P BSE 100.  Indian ELSS funds, on the other hand, had an excellent start to the year, with only 18% underperforming the S&P BSE 200.

Exhibit #1: SPIVA India Mid-Year 2023

Indian Equity Large-Cap Funds

  • The S&P BSE 100 gained 7.1% in H1 2023, and 58.1% of active managers underperformed the benchmark over that period.
  • Underperformance rates remained high over three- and five-year periods, at 86.2% and 92.9%, respectively.
  • Active managers produced relatively better results over the 10-year period, with the underperformance rate dropping to 61.2%.

Indian ELSS Funds

  • The S&P BSE 200 was up 6.2% in the first six months of 2023, and just 17.5% of Indian ELSS funds underperformed the index. Over the longer term, the underperformance rate rose, with 66.7% of funds underperforming the benchmark over the 10-year period.
  • Indian ELSS funds achieved the second-highest long-term survival rate across all categories in our SPIVA India Scorecard, with 75.0% of them still surviving after 10 years.

pdf-icon PD F Download Full Article

SPIVA® Europe Mid-Year 2023

Contributor Image
Benedek Vörös

Director, Index Investment Strategy

S&P Dow Jones Indices

Contributor Image
Maya Beyhan

Senior Director, ESG Specialist, Index Investment Strategy

S&P Dow Jones Indices

Contributor Image
Davide Di Gioia

Director, Index Investment Strategy

S&P Dow Jones Indices

Contributor Image
Grace Stoddart

Quantitative Associate, Index Investment Strategy

S&P Dow Jones Indices

Inaugurated in 2002, the S&P Indices versus Active (SPIVA) U.S. Scorecard has since been extended to Australia, Canada, Europe, India, Japan, Latin America, South Africa and the Middle East & North Africa (MENA), allowing investors to experience the active versus passive debate on a global scale.  First published in 2014, the semiannual SPIVA Europe Scorecard reports on the performance of actively managed funds domiciled across Europe.

Mid-Year 2023 Highlights

It was a challenging first half of 2023 for active managers in European equities, with over one-quarter of 22 categories recording underperformance rates of 90% or higher.  Fixed income managers had a better start to the year in relative terms, with no categories registering underperformance rates of over 90%.  Across both asset classes, however, underperformance rates increased to a similarly high average over a 10-year horizon.

Exhibit #1: SPIVA® Europe Mid-Year 2023
  • In H1 2023, 72% of British pound sterling-denominated and 76% of euro-denominated actively managed Europe Equity funds underperformed the S&P Europe 350®, while 77% of Eurozone Equity funds underperformed the S&P Eurozone BMI.
  • Euro-denominated Global Equity funds maintained a relatively high underperformance rate over longer time horizons. Over the 10-year period ending June 2023, 98% of funds underperformed the S&P Global 1200®.
  • British pound sterling- and euro-denominated U.S. Equity funds performed similarly, with 71% and 74% underperforming in the first half of 2023 in GBP and EUR, respectively, and 95% and 97%, respectively, underperforming over a 10-year horizon.
  • Only 12% of Poland Equity funds lagged the S&P Poland BMI in H1 2023, the lowest underperformance rate among major single-country categories.
  • Among country categories, 94%, 96% and 99% of France, Italy and Spain Equity funds lagged their benchmarks, respectively, in the first six months of 2023.
  • Actively managed K. Large-/Mid-Cap Equity funds had a good start to the year on a relative basis, with an underperformance rate of just 47% in H1 2023.
  • Meanwhile, 95% of actively managed U.K. Small-Cap Equity funds underperformed the S&P United Kingdom SmallCap in the first six months of 2023, the highest ever underperformance rate for this category.
  • For Government Bond (USD) funds, 86% underperformed the iBoxx Global Government United States in H1 2023, the highest underperformance rate among our fixed income categories. Meanwhile, Government Bond (GBP) funds performed relatively better, with 52% underperforming the iBoxx Sterling Gilts in the first half of 2023, although underperformance increased to 95% when measured over a 10-year period.
  • European corporate bond funds outperformed their high yield and government bond peers. Only 54% of Corporate Bond (EUR) funds underperformed the iBoxx Euro Corporates.  Meanwhile, 79% of High Yield Bond (EUR) funds underperformed the iBoxx Euro Liquid High Yield, while 81% of Government Bond (EUR) funds underperformed the iBoxx Euro Sovereigns in H1 2023.
  • Corporate Bond (USD) funds performed worse than their EUR and GBP peers, with 81% underperforming the iBoxx USD Corporates.

pdf-icon PD F Download Full Article

Processing ...