IN THIS LIST

SPIVA Japan Mid-Year 2022

SPIVA MENA Mid-Year 2022

SPIVA India Mid-Year 2022

SPIVA Latin America Mid-Year 2022

SPIVA Canada Mid-Year 2022

SPIVA Japan Mid-Year 2022

Contributor Image
Tim Edwards

Managing Director and Global Head of Index Investment Strategy

S&P Dow Jones Indices

Contributor Image
Anu R. Ganti

U.S. Head of Index Investment Strategy

S&P Dow Jones Indices

Contributor Image
Davide Di Gioia

Director, Index Investment Strategy

S&P Dow Jones Indices

Since the first publication of the S&P Indices Versus Active (SPIVA) U.S. Scorecard in 2002, S&P Dow Jones Indices has been the de facto scorekeeper of the ongoing active versus passive debate.

The SPIVA Japan Scorecard measures the performance of actively managed funds offered in Japan against their respective benchmarks over various time horizons, covering large-, mid- and small-cap as well as international and global equity funds.

Mid-Year 2022 Highlights

A firm majority of 72% of All Japanese Equity funds underperformed the broad-based S&P Japan 500 over the first six months of 2022, and a majority of equity funds underperformed their benchmarks in every reported category apart from one.  International Equity funds were the notable exception, with an underperformance rate of 35% in H1 2022.

SPIVA Japan Mid-Year 2022: Exhibit 1

  • The S&P/TOPIX 150 lost 5.19% in the first half of the year, and 69% of Japanese Large-Cap funds underperformed the index over the period. This was the worst underperformance rate reported for the large-cap category since June 2019, and it acted to push up the 10-year underperformance rate to 86% (from the 82% reported in December 2021).
  • It was a different story in the International Equity funds category, with just 35% of actively managed funds underperforming the S&P Global 1200 Ex-Japan in H1 2022.
  • For Japanese Mid-/Small-Cap funds, 77% underperformed the S&P Japan MidSmallCap, which declined 3.57% in H1 2022. However, the long-term record of actively managed Japanese Mid-/Small-Cap funds remained relatively admirable, with just 46%, 38% and 53% underperforming over the 3-, 5- and 10-year periods, respectively.

pdf-icon PD F Download Full Article

SPIVA MENA Mid-Year 2022

Contributor Image
Anu R. Ganti

U.S. Head of Index Investment Strategy

S&P Dow Jones Indices

Contributor Image
Davide Di Gioia

Director, Index Investment Strategy

S&P Dow Jones Indices

Since the first publication of the S&P Indices Versus Active Funds (SPIVA) U.S. Scorecard in 2002, S&P Dow Jones Indices has been the de facto scorekeeper of the ongoing active versus passive debate.

The SPIVA MENA Scorecard measures the performance of actively managed MENA equity funds against their respective benchmarks over various time horizons, providing statistics on outperformance rates, survivorship rates and fund performance dispersion.

MID-YEAR 2022 HIGHLIGHTS

MENA equities plummeted in Q2, but managed to post slight YTD gains thanks to a stellar Q1, led in particular by the S&P Pan Arab Composite LargeMidCap Index.  The majority of funds across all categories outperformed their respective benchmarks, with just 27% of MENA Equity funds underperforming the broad S&P Pan Arab Composite (see Exhibit 1).

SPIVA® MENA Mid-Year 2022 - Exhibit 1

MENA 

  • For MENA Equity funds, 32% underperformed the S&P Pan Arab Composite LargeMidCap Index during the first half of 2022, while 27% underperformed the broader S&P Pan Arab Composite.
  • Fewer funds were able to maintain their record of outperformance over the 10-year period, with 91% of funds underperforming both benchmarks.
  • Funds in this category gained 6.76% and 8.33% on an equal- and asset-weighted bases, respectively, over a 10-year period, implying that larger funds performed relatively better than smaller funds on average.
  • Only 40% of the funds analyzed within the MENA Equity fund category survived the 10-year period.

GCC

  • Equity funds focused on the Gulf Cooperation Council (GCC) region fared similarly, with 37% underperforming the S&P GCC Composite over the six-month period.
  • Underperformance rates peaked over the five-year period, at 96%.
  • Smaller funds performed relatively better than larger funds over the 1-, 3-, 5-, and 10-year periods.

Saudi Arabia

  • For the six-month period, 31% of Saudi Arabia Equity funds underperformed the S&P Saudi Arabia.
  • Some funds will always do better than average, and others worse, but fund selection risk was particularly heightened among Saudi funds, with an interquartile range of 12% among one-year fund performances.
  • The survival rates of active funds in Saudi Araba were the highest among all categories, with 85% of funds surviving over the 10-year period.


SPIVA India Mid-Year 2022

Contributor Image
Benedek Vörös

Director, Index Investment Strategy

S&P Dow Jones Indices

Contributor Image
Davide Di Gioia

Director, Index Investment Strategy

S&P Dow Jones Indices

Since the first publication of the S&P Indices Versus Active Funds (SPIVA) U.S. Scorecard in 2002, S&P Dow Jones Indices has been the de facto scorekeeper of the ongoing active versus passive debate.

The SPIVA India Scorecard compares the performance of actively managed Indian equity and bond mutual funds with their respective benchmark indices YTD and over 1-, 3-, 5- and 10-year investment horizons.

Mid-Year 2022 Highlights

In the first half of 2022, performance among Indian active managers was greatly mixed across categories. There was an unusually high underperformance rate in Indian Equity Large-Cap funds, where 88% of actively managed funds underperformed the S&P BSE 100, and an unusually low proportion—just 19%—of Indian Composite Bond funds underperformed the S&P BSE India Bond Index.

pdf-icon PD F Download Full Article

SPIVA Latin America Mid-Year 2022

SUMMARY

The SPIVA Latin America Scorecard measures the performance of actively managed funds across Brazil, Chile and Mexico against their respective benchmarks over various time horizons, providing statistics on outperformance rates, survivorship rates and fund performance dispersion.

Since the first publication of the S&P Indices Versus Active Funds (SPIVA) U.S. Scorecard in 2002, S&P Dow Jones Indices has been the de facto scorekeeper of the ongoing active versus passive debate.

Mid-Year 2022 Highlights

In the first half of 2022, performance among Latin American active managers was greatly mixed across countries. Mexico was a rare bright spot, with less than 50% of managers underperforming the S&P/BMV IRT. The majority of active managers in Brazil and Chile failed to outperform over longer periods.

SPIVA Latin America Mid-Year 2022 Exhibit 1

Mexico

The S&P/BMV IRT lost 9.3% over the first half of 2022, and 63% of active managers outperformed the S&P/BMV IRT over that period.

Fewer funds were able to maintain their record of outperformance over the five-year period, with 80% of the funds underperforming their benchmark.

Coupled with the outperformance of most active managers in the first half of the year, the survival rates of active funds in Mexico were among the highest in Latin America, at 100%, 94%, 91% and 78% over the 1-, 3-, 5-, and 10-year periods, respectively.

Brazil

The S&P Brazil BMI fell by 8.94% YTD, and 57% of Brazil Large-Cap funds underperformed the index. Their long-term record was even worse, with 80% of funds underperforming over a 10-year period.

Large-cap companies only declined by 6.15% YTD, as measured by the S&P Brazil LargeCap. Funds in this category lost 8.14% and 7.34% on equal- and asset-weighted bases, respectively, over the same period.

Chile

Chilean equities were a bright spot, with the S&P Chile BMI up 20.46% YTD. However, 94% of Chile Equity funds underperformed the index over the same period, and 98% of Chilean Equity funds underperformed over 10 years.

Larger funds performed relatively better than smaller funds over one and three years periods on average, while smaller funds outperformed over five and ten-year periods.

Fixed Income

Meanwhile, 64% of Brazil Government Bond funds outperformed their benchmark over a six-month period. Consistent with their equity peers, rates of underperformance increased over longer periods.

Brazil Corporate Bond funds fared slightly worse, with 53% underperforming their benchmark over a six-month period.


SPIVA Canada Mid-Year 2022

Contributor Image
Joseph Nelesen, Ph.D.

Head of Specialists, Index Investment Strategy

S&P Dow Jones Indices

Contributor Image
Tim Edwards

Managing Director and Global Head of Index Investment Strategy

S&P Dow Jones Indices

Contributor Image
Anu R. Ganti

U.S. Head of Index Investment Strategy

S&P Dow Jones Indices

Contributor Image
Davide Di Gioia

Director, Index Investment Strategy

S&P Dow Jones Indices

Since the first publication of the S&P Indices Versus Active Funds (SPIVA) U.S. Scorecard in 2002, S&P Dow Jones Indices has been the de facto scorekeeper of the ongoing active versus passive debate.

The SPIVA Canada Scorecard measures the performance of Canadian actively managed funds against their respective benchmarks over various time horizons, covering large-, mid- and small-cap as well as international and global equity funds.

Mid-Year 2022 Highlights

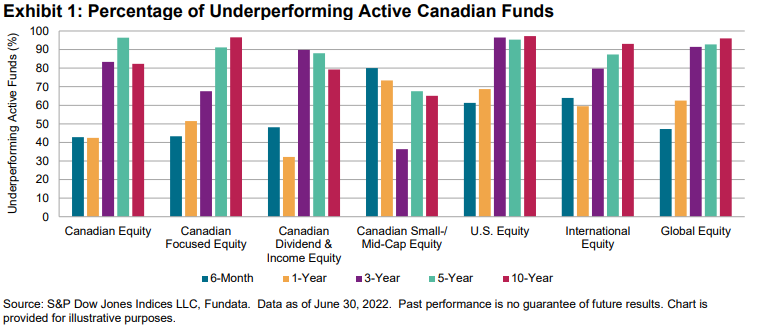
In the turmoil of the first half of 2022, actively managed funds in Canada navigated the challenges relatively well. Less than one-half of active funds underperformed their benchmarks in the Canadian Equity (43%), Canadian Focused Equity (43%), Canadian Dividend & Income Equity (48%) and Global Equity (47%) categories (see Exhibit 1 and Report 1). Underperformance rates generally increased with measurement horizons, with a cross-category average of 90% of active funds underperforming over the past 10 years.

SPIVA Canada Mid-Year 2022: Exhibit 1

- Canadian Equity Funds: The S&P/TSX Composite fell 9.9% in H1 2022 and Canadian Equity funds dropped 9.0% and 9.3% on equal and asset-weighted bases, respectively. Underperformance rates hit 43% over six months, climbing to 83%, 96% and 82% over the 3-, 5- and 10-year horizons, respectively.

- Canadian Focused Equity Funds: The blended benchmark of 50% S&P/TSX Composite + 25% S&P 500® + 25% S&P EPAC LargeMidCap fell 14.7% in H1 2022, outperforming 43% of Canadian Focused Equity funds. This rose to 68%, 91% and 97% over the 3-, 5- and 10-year horizons, respectively.

- Canadian Dividend & Income Equity Funds: The S&P/TSX Canadian Dividend Aristocrats® Index fell 5.3% during H1 2022, while Canadian Dividend & Income Equity funds lost 5.8% and 5.5% on equal and asset-weighted bases, respectively. Underperformance rates reached 48% over six months, and rose to 90%, 88% and 79% over the 3-, 5- and 10-year horizons, respectively.

- Canadian Small-/Mid-Cap Equity Funds: The S&P/TSX Completion Index dipped 10.9% in H1 2022, and 80% of Canadian Equity Small-Mid-Cap funds underperformed the index. Funds in this category lost 16.4% and 15.6% on equal- and asset-weighted bases, respectively, over six months.

- U.S. Equity Funds: The S&P 500 shed 18.3% in the first six months of 2022, and 61.3% of U.S. Equity funds underperformed the index. Very few funds in the U.S. Equity category outperformed over the long term, with 97%, 95% and 97% underperforming over 3-, 5- and 10-year horizons, respectively.

- International Equity Funds: 64% of International Equity funds trailed the S&P EPAC LargeMidCap, and 87% and 93% underperformed over 5- and 10-year periods, respectively.

- Global Equity Funds: The S&P EPAC LargeMidCap fell 18.5% during H1 2022 and Global Equity funds sank 19.7% and 19.6% on equal and asset-weighted bases, respectively. Over the six-month period, 47% of funds in the category trailed the benchmark. Over the 3- 5- and 10-year periods, 91%, 93% and 96% of funds underperformed, respectively.

- Fund Survivorship: Liquidation rates for all categories were in single digits for the one-year period ending June 30, 2022. Canadian Focused Equity had the highest attrition rate, at 96%. Over the 10-year period, 47% of Canadian Equity funds merged or liquidated and an average of 40% of funds disappeared across all categories (see Report 2).

pdf-icon PD F Download Full Article

Processing ...