SUMMARY
After a dismal 2022, the market recovered with a vengeance in 2023 and the S&P 500® gained an impressive 26%. Optimism that the U.S. Federal Reserve would be able to engineer a soft landing accompanied a broadening of the rally to the S&P MidCap 400® and the S&P SmallCap 600®, which both climbed 16%. Meanwhile, despite persistent inflation concerns and a rough start to the year for regional banks, U.S. fixed income markets also gained in 2023—albeit less materially and with a few more bumps along the way.
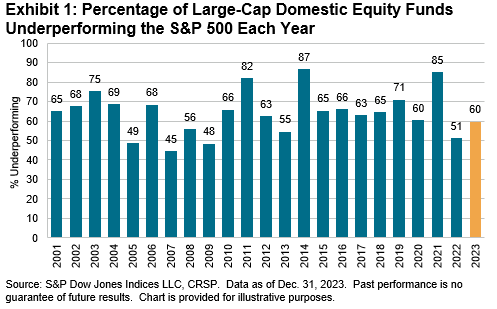
Over the full year, a majority of actively managed funds underperformed their assigned benchmarks in most of our reported fund categories. In our largest and most closely watched comparison, 60% of all active large-cap U.S. equity funds underperformed the S&P 500. This figure was better than might have been expected given the dominance of the U.S. equity market’s largest stocks, placing 2023’s underperformance rate close to, but just below, the 64% average annual rate reported over the 23-year history of our SPIVA Scorecards.

Sign up to receive updates via email
Sign Up
Perhaps aided by their ability to opportunistically tilt toward outperforming large caps, the results were generally better for funds in smaller-capitalization U.S. equity categories: just 50% of All Mid-Cap funds lagged the S&P MidCap 400 and only 48% of All Small-Cap funds underperformed the S&P SmallCap 600. Small-Cap Value was a particular bright spot, with only 37% of funds underperforming the S&P SmallCap 600 Value.
Turning to international equity categories, nearly three-quarters (74%) of funds in the Global category underperformed, but at least in relative terms, International Small-Cap Funds continued to offer more fertile grounds for actively managed funds: just 54% underperformed.
Fixed income results, with an underperformance rate of 59% across all fund categories, were more mixed, with 9 out of our 17 reported categories posting majority underperformance. At one extreme, 98% of funds in the General Investment-Grade category and 80% of High Yield funds underperformed. Municipal and emerging debt were among the categories that saw majority outperformance.
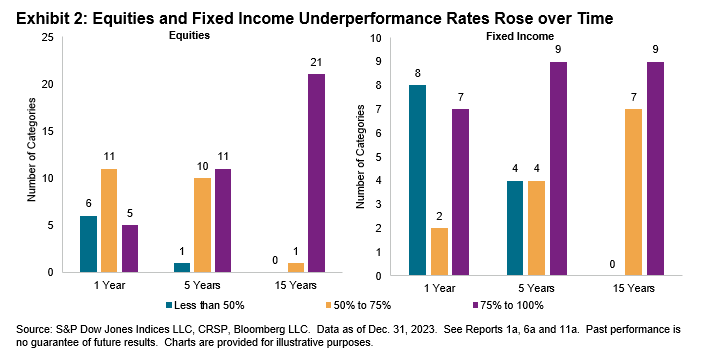
Across all categories, underperformance rates typically rose as time horizons lengthened. Exhibit 2 illustrates the point. At the one-year horizon, 6 of 22 equity categories and 8 of 17 fixed income categories saw majority outperformance, falling to just 1 equity category and 4 fixed income categories over five years. At the 15-year horizon in both asset classes, there were no categories in which the majority of active managers outperformed.


