SUMMARY
In this report, we add institutional accounts to the mutual funds analyzed in the S&P Indices Versus Active (SPIVA®) U.S. Scorecard. We aim to provide the institutional community with the ability to judge managers' true skills without the possible distortions that fees may create on performance comparisons. We also examine the impact of fees on both account types. By comparing retail mutual funds and institutional accounts on a gross-of-fees basis against their respective benchmarks, we eliminate the possibility that fees are the sole contributor to a given manager's underperformance.
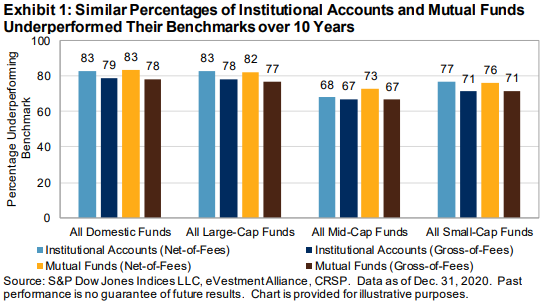
Overall, underperformance among institutional equity accounts was not meaningfully different from that reported for mutual funds. For example, 78% of large-cap institutional accounts and 77% of large-cap mutual fund managers underperformed the S&P 500® on a gross-of-fees basis over the past 10 years. Net-of-fees, of course, results were even worse, with an additional 5% of large-cap institutional and mutual fund managers underperforming the benchmark (see Exhibit 1).

Institutional accounts had a better chance than their mutual fund counterparts of outperforming their benchmarks (gross-of-fees) in 12 of the 17 domestic equity fund categories tracked. Nonetheless, the majority of institutional accounts across all equity fund categories underperformed over the 10-year period, ranging from a high of 85% of multi-cap core funds to a low of 50% of mid-cap growth funds (see Report 1).
Sign up to receive updates via email
Sign Up
The volatility in financial markets in 2020 provided ample opportunity for fund managers to show their stock-picking skills. Growth managers in particular were well positioned to benefit from the accelerated lifestyle changes as a result of the pandemic. A stellar 86% of small-cap growth and mid-cap growth institutional funds were able to beat the S&P MidCap 400® Growth and S&P SmallCap 600® Growth, respectively, in 2021. A less impressive 53% of large-cap growth funds beat the S&P 500 Growth. However, the longer-term statistics remained sobering, as just 23%, 50%, and 43% of large-, mid-, and small-cap growth funds, respectively, were able to stay ahead of their benchmarks for the 10-year horizon. This might be explained by the remarkable outperformance of the S&P 500 Growth (33.5%) over the S&P MidCap 400 Growth (22.8%) and the S&P SmallCap 600 Growth (19.6%) in 2020. Tilting toward larger-cap stocks no longer helped these active funds when the performance gap narrowed over longer time periods (see Report 1).
The story was broadly similar for value fund managers. Although value indices continued to trail growth indices as they did for much of the previous decade, value managers joined the 2020 outperformance party: 71%, 54%, and 66% of large-cap, mid-cap, and small-cap value funds beat their benchmarks, respectively. The 10-year tale was somewhat less celebratory, as just 38%, 39%, and 29% managed the feat over the longer period (see Report 1).
International funds were a notable exception to 2020's equity exuberance. In all four categories across all four time periods analyzed, the majority of funds fell short of their benchmarks (see Report 6).
Fixed income results were mixed, as a majority of funds in 8 of the 17 categories underperformed their benchmarks over the 1- and 10-year horizons (see Report 11).
As a fourth round of quantitative easing took place in the U.S., lower interest rates and a rush to the suburbs soon followed, buoying home prices (and prompting refinancings). MBS funds took full advantage, as 75% beat the Bloomberg Barclays U.S. MBS Index in 2020, the best of any fixed income category. A respectable 62% also did so over the previous 10 years (see Report 11).
Government funds did not come along for the fixed income ride. While the Bloomberg Barclays U.S. Government Index posted a healthy 7.94% return in 2020, actively managed government funds only squeezed out a 6.69% return on an equal-weighted basis and 5.71% on an asset-weighted basis. This led to a worst-in-class 24% of active managers that managed to surpass their benchmarks in 2020, while a woeful 11% did so over the previous 10 years (see Reports 11, 13, and 14).
Among mutual funds, active international equity managers showed greater differences between the gross- and net-of-fees relative performance figures than did their domestic fund peers. No such notable difference between categories was observed among institutional accounts (see Exhibits 2 and 3).
For fixed income funds, relative performance chances suffered the greatest impact from fees in the emerging markets debt space. While 37% of institutional emerging markets hard currency funds failed to clear the benchmark over the past 10 years, gross-of-fees, 100% failed to do so net-of-fees (see Exhibit 5).


