


Summary
For over two decades, S&P Dow Jones Indices’ SPIVA Scorecards have compared the performance of actively managed funds to appropriate benchmarks. Initially covering just U.S.-domiciled funds, nine regional year-end scorecards now cover active performance in funds operating in markets from Australia to Chile.
For the first time, this mid-year global report aggregates key statistics from across regions to produce a single, consolidated update on the performance of actively managed funds around the world.
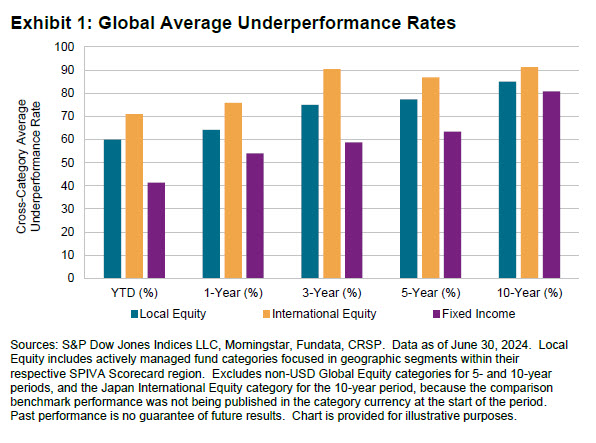
Exhibit 1 shows a cross-category summary of the average underperformance rates reported for actively managed funds spanning across regions in the first half of 2024 and longer periods, across local equity, international equity and fixed income categories.
Highlights
The first half of 2024 will likely go down as another generally challenging period for the active management industry, most notably for funds focused on U.S. or global equities.
Over the six-month period ending June 2024, across the 56 equity and fixed income fund categories included in this report, a majority of funds underperformed in over two-thirds of reported categories. Of the 8,417 unique funds represented across all the half-year statistics, a similar figure (64%) of individual funds underperformed their assigned benchmark.
Accompanied by the outperformance of the very largest companies, the first half of 2024 proved to be a particularly difficult market environment for active managers across developed equity markets. A majority of Global Equity funds domiciled in the U.S., Europe, Japan, Canada and Australia underperformed the S&P World Index, with underperformance rates all falling within the range of 70%-85%.
Part of the disappointing performance of actively managed Global Equity funds may have been down to the difficulty of outperforming in the U.S. component, with majorities ranging between 57% to 78% of U.S. equity-focused funds in the U.S., Europe, Japan and Canada underperforming the S&P 500®. However, there were also challenging headwinds in other developed equity markets, including the continental Europe majors of Switzerland, France and Germany, where 76%, 85% and 88% of local active funds underperformed, respectively.
Those seeking outperforming actively managed equity funds would have found the odds in their favor in a select few markets during the first half of 2024. Most notably, a significant majority (85%) of U.S.-based domestic small-cap active funds outperformed the S&P SmallCap 600®, while active equity funds in the Middle East built on their 2023 domestic record with another strong beat rate, with a similar figure outperforming the S&P Pan Arab Composite LargeMidCap Index. Actively managed domestic equity funds in South Africa and Mexico also performed relatively well, with beat rates close to or above 50%.
There were some other bright spots to be found for active performance, particularly in fixed income categories. On both sides of the Atlantic, lower-credit and less-liquid bonds broadly outperformed and, since both are often seen as sources of potential excess returns, it may not be surprising that the U.S. dollar and euro-denominated fixed income markets hosted some of the most fertile grounds for actively managed funds. Overall, we report majority outperformance in 9 out of 12 fixed income categories, including the lowest underperformance rate reported in this scorecard—just 13% of U.S.-domiciled Investment Grade Short and Intermediate Bond funds underperformed the iBoxx $ Overall 1-5 Year Index.
