The SPIVA Australia Scorecard measures the performance of actively managed funds relative to benchmarks over various time horizons, covering equity, real estate and bond funds, and providing statistics on outperformance rates, survivorship rates and fund performance dispersion. In this year-end 2023 edition, domestic equity funds in New Zealand are included for the first time.
2023 Highlights
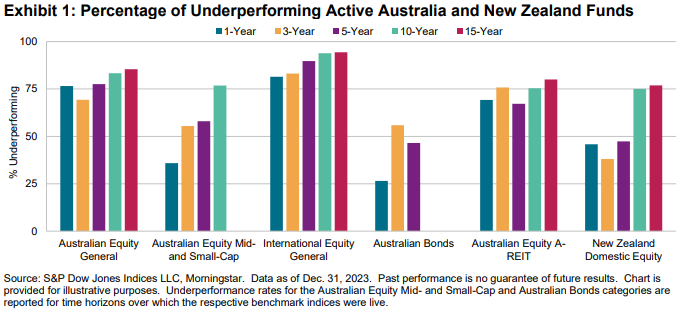
It was among the best of times and the worst of times for actively managed funds. In the Australian Equity General category, more than three-quarters of active managers failed to keep up with the S&P/ASX 200, and a similar story was seen in the International Equity General category. Meanwhile, active bond managers had an exceptional year, with almost three-quarters of Australian Bonds funds beating the S&P/ASX Australian Fixed Interest 0+ Index. Exhibit 1 summarizes the results across all our reported categories.

- Australian Equity General Funds: The S&P/ASX 200 ended the year up 12.4%, and Australian Equity General funds struggled to keep up; the one-year underperformance rate of 77% was the second highest in our records (see Exhibit 8). Longer term, underperformance rates were even higher, rising to 85% of funds underperforming the benchmark over 15 years.
- Australian Equity Mid- and Small-Cap Funds: The S&P/ASX Mid-Small gained 7.8% in 2023 and a firm majority (64%) of actively managed Australian Equity Mid- and Small-Cap funds managed to beat it. Funds in the category gained 10.8% and 13.0% on an equal- and asset-weighted average basis, respectively. More such years will be required to change the longer-term statistics, however, with 77% of funds currently lagging over 10 years.
- International Equity General Funds: International equity funds posted average 2023 returns of 20.3% and 19.2% on an equal- and asset-weighted basis, respectively, with 81% of funds trailing the S&P Developed Ex-Australia LargeMidCap's total return of 24.1%. Over the 10- and 15-year horizons, around 94% of funds underperformed.
- Australian Bonds Funds: Active managers in the Australian Bonds category posted their lowest one-year underperformance rate since the 2015 launch of the S&P/ASX Australian Fixed Interest 0+ Index, with just 26% of funds lagging the index. The longer-term record was also better relative to other categories, with 56% and 46% underperforming over the three- and five-year periods, respectively.
- Australian Equity A-REIT Funds: After a challenging start to the year, active managers in the Australian Equity A-REIT category improved their underperformance rate to 69%over the full year. Over the 15-year period, 80% of active funds underperformed.
- New Zealand Domestic Equity Funds: Over the one-year period, actively managed funds in the New Zealand Domestic Equity category gained 4.8% and 5.1% on an equal- and asset-weighted basis, compared to a 3.5% gross return with imputation for the S&P/NZX 50 Index. Within this category, 54% of active funds outperformed over oneyear, but just 23% outperformed over the 15-year period.
- Fund Survivorship: Liquidation rates for most active fund categories were moderate in 2023. International Equity General Funds recorded the highest liquidation rate at 7.7%. In contrast, none of the New Zealand Domestic Equity funds were liquidated, while only 1.3% of Australian Equity Mid- and Small-Cap funds failed to survive. The attrition rate increased over longer time horizons, with 57% of funds across all categories merged or liquidated over the 15-year period.


