


The SPIVA Australia Scorecard measures the performance of actively managed Australian funds against their respective benchmarks over various time horizons, covering large-, mid- and small-cap equity funds, real estate funds and bond funds, and providing statistics on outperformance rates, survivorship rates and fund performance dispersion.
Year-End 2022 Highlights
After a promising start in relative terms, actively managed Australian Equity General funds found it harder to stay ahead of the market in the second half of the year, resulting in a full-year underperformance rate of 58% compared with the S&P/ASX 200. Meanwhile, there were better odds of finding an outperforming active manager in the A-REIT category, while, after several years of generally better performance, roughly three-quarters of funds in the mid- and small-cap equity category lagged in 2022.
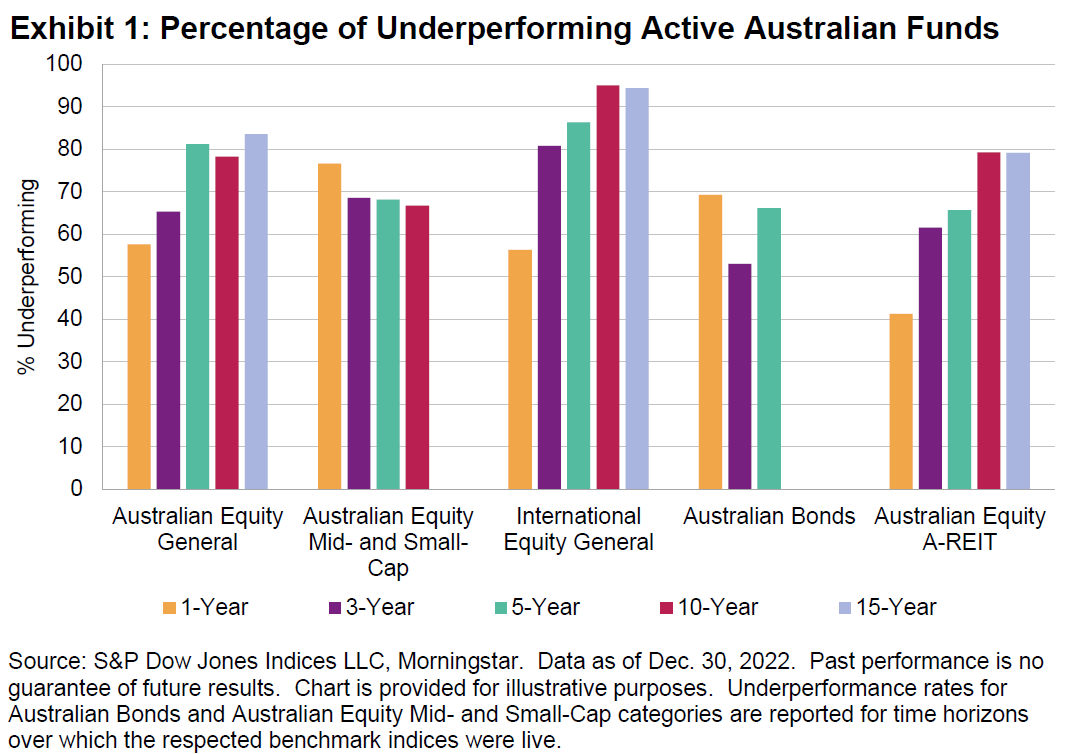
- Australian Equity General Funds: Having dropped 9.9% in the first six months of the year, the S&P/ASX 200 rose 9.8% in H2 2022 to close the year down 1%. After a relatively good start to the year, Australian Equity General funds endured a challenging second half, with 78.5% of managers underperforming the benchmark, bringing the full year underperformance rate to 57.6%. Over the longer term, underperformance rates were even higher, with 81.2%, 78.2% and 83.6% of funds underperforming the S&P/ASX 200 over the 5-, 10- and 15-year horizons, respectively.
- Australian Equity Mid- and Small-Cap Funds: The S&P/ASX Mid-Small rallied 10.1% in the second half of 2022 to close the year down 12.2%. Just 23.4% of Australian Equity Mid- and Small-Cap funds beat the index in 2022, while over 80% underperformed on a risk-adjusted basis. Funds in this category lost 19.8% and 22.0% on equal- and asset-weighted bases, respectively, for the same period. The longer-term record within the small- and mid-cap category was relatively stronger, with just 54.7% underperforming over the 15-year period.
- International Equity General Funds: International equity funds posted -13.9% and -13.2% on equal- and asset-weighted bases in 2022, with 56.3% of funds failing to keep up with the S&P Developed Ex-Australia LargeMidCap in 2022. Over the 5- and 10-year periods, more than 86% and 95% of funds underperformed, respectively.
- Australian Bond Funds: The S&P/ASX Australian Fixed Interest 0+ Index slumped 10.1% in 2022, with 69.2% of funds in the Australian Bonds category underperforming the benchmark. Active funds had a similar record over the longer term: 66.1% and 79.3% underperformed over 5- and 10-year periods, respectively.
- Australian Equity A-REIT Funds: Active managers in the Australian Equity A-REIT category posted their lowest underperformance rate since the launch of the SPIVA Australia Scorecard in 2013, with just 41.2% of funds underperforming the benchmark. Active managers’ outperformance came in one of the toughest years for the segment in recent memory: the S&P/ASX 200 A-REIT dropped 20%, its worst annual performance since 2008. Underperformance rates rose over longer time frames, reaching 79.1% over the 15-year horizon.
- Fund Survivorship: Liquidation rates for most active fund categories were moderate over the one-year period ending Dec. 30, 2022. Australian Equity General funds recorded the highest liquidation rate, at 7.4%. In contrast, only 2.0% of Australian Equity A-REIT funds failed to survive. Over the longer term, survivorship rates were significantly lower, with over 50% of funds merged or liquidated over a 15-year horizon in all but one reported category (see Report 2).
