Summary
“Should five per cent appear too small,
be thankful I don't take it all.”
“Taxman”, George Harrison
Since 2002, S&P Dow Jones Indices has evaluated index versus active fund performance through the SPIVA Scorecards. In this report, we revisit the broad U.S. domestic equity categories with an additional layer of analysis, comparing the putative after-tax performance of indices and active funds.
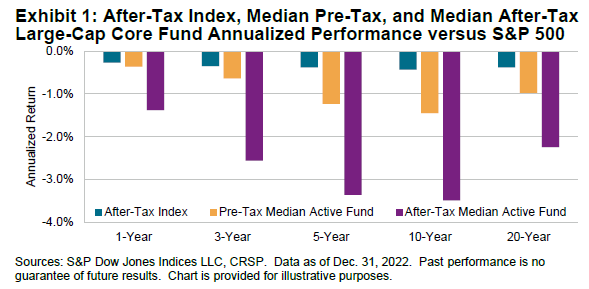
The average cumulative effects of taxes on investor returns are summarized in Exhibit 1 for the Large-Cap Core fund category. After tax, the median active fund trailed the S&P 500® over every time horizon, by up to 3.5% annually (see Exhibit 1).

Introduction
A passive, capitalization-weighted approach to equities can require a counterintuitive degree of patience: stocks are never excluded the S&P 500 just for being too expensive. Instead, stocks with market-beating price increases are—all else remaining equal—provided with increasing weights. This fact is often criticized by proponents of a more active approach, who point to their ability to sell overpriced securities when profit-taking is more prudent than passivity. However, 20 years of S&P Dow Jones Indices’ SPIVA Scorecards collectively attest that the ability to consistently identify the right time to sell in order to “beat the market” is relatively rare.
But the difficulty of successful market timing and stock picking are not the only factors in favor of the patience encoded in indices like the S&P 500. Further grounds may be provided by considering that even the sale of long-held profitable positions can invite unwelcome tax consequences, while the gains from short-term trading activity are normally diminished by a yet higher tax rate. Accordingly, it might seem reasonable to conjecture that outperforming broad, capitalization-weighted indices might prove even harder after accounting for the tax consequences of active trading.
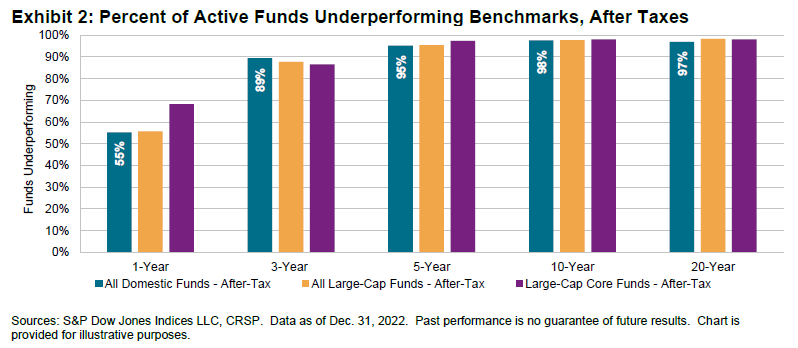
The existence of a common standard for reporting after-tax returns in U.S. mutual funds provides a way to test this conjecture and the motivation for this report, which extends the traditional SPIVA Scorecards to include after-tax comparisons for selected categories. Exhibit 2 highlights selected statistics from the later detail, confirming the relatively high long-term after-tax underperformance rates for actively managed U.S. domestic equity mutual funds.


