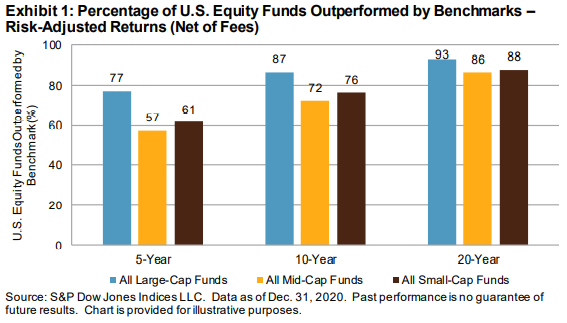
Since 2002, SPIVA scorecards have shown that active funds typically underperform their benchmarks on an absolute return basis. However, active funds could compare favorably to passive investments after adjusting for volatility, if lower active returns were a consequence of risk reduction.
The Risk-Adjusted SPIVA Scorecard considers this possibility by comparing the risk-adjusted returns of actively managed funds against their benchmarks on a net-of-fees and gross-of-fees basis. We use the standard deviation of monthly returns as a measure of risk and evaluate performance by comparing return/volatility ratios.
After a relatively quiet decade following the Global Financial Crisis, volatility returned with a vengeance in 2020. Backed by fiscal and monetary stimulus, the S&P 500® gained 18.4% on the year, though this bout of volatility and positive returns did little to help the case for active management. After adjusting for volatility, the majority of actively managed domestic funds across market cap segments underperformed their benchmarks on a net-of-fees basis over mid-and long-term investment horizons.

Mid-cap and small-cap growth funds were interesting exceptions in a sea of underperformance. Over a five-year period, nearly two-thirds of funds in both categories outperformed, whereas only one-quarter of large-cap growth funds outperformed. Active managers focusing on smaller-capitalization companies may have skewed their portfolios toward the market-leading larger companies recently, but this peculiarity faded away over the long term. Over the 10- and 20-year periods, mid-cap and small-cap growth funds reverted to form and matched their large-cap compatriots, with fewer than 10% managing to outperform in any of the three categories.
Naturally, the risk-adjusted performance of active funds improves on a gross-of-fees basis, but even then, outperformance is scarce. Viewed over a five-year period, a majority of funds in only 6 of the 18 domestic equity categories tracked were able to outperform their benchmarks. Over a 20-year window, only two domestic equity categories showed the majority of funds outperforming their benchmarks.
As in the U.S., the majority of international equity funds across all categories generated lower risk-adjusted returns than their benchmarks when using net-of-fees returns over the previous five-year period. International equity funds also matched their domestic peers over the longer term, as fewer than 15% surpassed their benchmarks over a 20-year horizon. On a gross-of-fees basis, the only bright spot was international small-cap funds in the 10-year window, of which 64% cleared their hurdle rate.
When using net-of-fees risk-adjusted returns, the majority of actively managed fixed income funds in most categories underperformed across all three investment horizons. The only exceptions were government long funds and investment-grade long funds over the 5- and 10-year periods.
The importance (and performance-sapping nature) of fees is well highlighted when analyzing fixed income fund performance in a low-yield world. A respectable 9 of the 14 fixed income categories showed a majority of funds outperforming their benchmarks on a gross-of-fees basis over the past 15 years.
On a net-of-fees basis, asset-weighted return/volatility ratios for active portfolios were higher than the corresponding equal-weighted ratios, indicating that larger firms have taken on higher-compensated risk than smaller ones. On an asset-weighted basis, large-cap value, small-cap value, mid-cap core, multi-cap value, and REIT funds were the only domestic equity categories to provide better return/volatility ratios than the benchmark over 20 years. On an equal-weighted measure, this fell to just three categories: large-cap value, small-cap value, and real estate funds.
Most fund categories produced higher return/volatility ratios than their benchmarks, gross of fees, on an equal-weighted basis. However, their outperformance diminished once fees or fund size were accounted for, especially in domestic and international equity funds. In general, equal-weighted return/volatility ratios improved more than the corresponding asset-weighted ratios when fees were ignored, indicating that fees play a more prominent role in smaller funds' performance.


