IN THIS LIST

Persistence Scorecard Latin America Year-End 2021

SPIVA® Europe Year-End 2021

SPIVA South Africa Year-End 2021

SPIVA U.S. Year-End 2021

SPIVA Australia Year-End 2021

Persistence Scorecard Latin America Year-End 2021

Contributor Image
María Sánchez

Director, Sustainability Index Product Management, U.S. Equity Indices

S&P Dow Jones Indices

INTRODUCTION

A key dimension of any active versus passive debate is managers’ ability to consistently deliver above-average returns over multiple periods.  Persistence in performance is one out of many possible ways to differentiate skill from luck.

In this report, we measure the performance persistence of active funds in Brazil, Chile, and Mexico that outperformed their peers over consecutive three- and five-year periods.  We also analyze how their performance ranking transitioned over subsequent periods.

SUMMARY OF RESULTS

Brazil

  • Top performers in Brazilian fixed income fund categories showed better chances than equity categories of remaining in the top quartile over three years (see Report 1).

Latin America Persistence Scorecard Year-End-2021: Exhibit 1

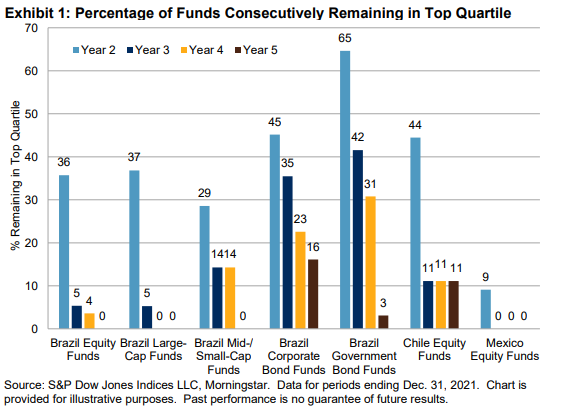
  • Report 2 highlights the inability of top-performing equity fund managers to consistently repeatsuccess in subsequent years. The Brazil Large-Cap Fund category was the least persistent—by the fourth year, none of them remained in the top quartile. Moreover, none of the top performers in the Brazil Equity Fund and Brazil Mid-/Small-Cap Fund categories remained in the top quartile by the fifth year./li>
  • The majority of corporate bond fund managers did not maintain consistent outperformance for five years in a row; only 16% of them did so. Brazil Government Bond Funds did not showbetter results; 3% of them delivered consistent outperformance for five years in a row (see Report 2).
  • The five-year transition matrix (see Report 5) highlights the Brazil Government Bond Fund category. The chance of a winning fund remaining in the top quartile after five one-year periods was the highest among categories, with 66% funds remaining in the first quartile

Chile

  • Report 2 shows the lack of persistence by equity managers in Chile—11% of top-performing funds in the first 12-month period repeated their outperformance after five years.
  • Report 3 shows that 29% of the top-quartile funds in the first period of the three-year transition matrix remained in the top quartile.
  • Funds in the second, third and fourth quartile of the five-year transition matrix were more likely to be liquidated (56%, 33% and 60%, respectively) than to stay or move to lower quartiles (see Report 5).

Mexico

  • As observed in the SPIVA® Latin America Mid-Year 2021 Scorecard, Mexico had a higher rate of fund survivors than Brazil and Chile in the three- and five-year periods. Reports 3, 4, 5 and 6 show that Mexican funds had less chance of being shut down than Brazilian and Chilean funds.
  • The five-year performance persistence test (see Report 2) shows that top-quartile managers had difficulty replicating their outperformance in subsequent years. After one year, just 9% of managers remained in the top quartile, and by the end of year two, none remained.

pdf-icon PD F Download Full Article

SPIVA® Europe Year-End 2021

Contributor Image
Andrew Innes

Head of Global Research & Design

S&P Dow Jones Indices

Contributor Image
Andrew Cairns

Senior Director, Global Research & Design

S&P Dow Jones Indices

S&P Dow Jones Indices has been the de facto scorekeeper of the ongoing active versus passive debate since the first publication of the S&P Indices Versus Active Funds (SPIVA) U.S. Scorecard in 2002.  The SPIVA Europe Scorecard measures the performance of actively managed European equity funds denominated in euro (EUR), British pound sterling (GBP), and other European local currencies against the performance of their respective S&P DJI benchmark indices over 1-, 3-, 5-, and 10-year investment horizons.

YEAR-END 2021 HIGHLIGHTS

In spite of the ongoing COVID-19 pandemic throughout 2021, European equity markets were buoyant, recovering well from the extreme volatility of the previous year. The S&P Europe 350® was up 26.1% in 2021. 

  • Of active euro-denominated Europe Equity funds, 74.8% underperformed the S&P Europe 350 in 2021. On a risk-adjusted basis the same group of funds generally fared no better, with 79.7% and 84.3% underperforming over the 1- and 10-year period respectively. 

  • European regional benchmarks saw double-digit returns across the board, with many returning over 20% for the one-year period. The picture was similar for fund managers, with all categories seeing returns in excess of 10% for the year. 

  • Despite the strong returns, fewer European fund managers beat the benchmark than in the prior year, as evidenced by Report 1c. In each category, there was an increase in the percentage of funds outperformed by their benchmark. 

  • Europe Equity funds saw a 37.4% absolute increase in the percentage of funds outperformed by their benchmark from 2020 to 2021, and the volatility of the benchmark was 27.9% in 2020 and 12.3% in 2021. From this we can surmise that, on average, fund managers in this region may have utilized their skills better during more volatile market conditions than in a comparatively stable environment. However, as SPIVA frequently witnesses, any short-term success typically dissipates as the time horizon increases. For instance, 83.2% of Europe Equity funds underperformed the S&P Europe 350 over the 10-year period. 

pdf-icon PD F Download Full Article

SPIVA South Africa Year-End 2021

Contributor Image
Andrew Innes

Head of Global Research & Design

S&P Dow Jones Indices

Contributor Image
Andrew Cairns

Senior Director, Global Research & Design

S&P Dow Jones Indices

S&P Dow Jones Indices has been the de facto scorekeeper of the ongoing active versus passive debate since the first publication of the S&P Indices Versus Active (SPIVA) U.S. Scorecard in 2002.  The SPIVA South Africa Scorecard measures the performance of actively managed South African equity and fixed income funds denominated in South African rands (ZAR) against their respective benchmark indices over six-month and 1-, 3-, 5-, and 10-year investment horizons. 

YEAR-END 2021 HIGHLIGHTS

South African Equity

During 2021, South African equities, as represented by the S&P South Africa Domestic Shareholder Weighted (DSW) Capped Index, posted a solid return of 26.2%.  However, this was once again surpassed by S&P DJI’s large-cap benchmark for the country, the S&P South Africa 50, which was up 30.5% for the year.  The performance of this large-cap index continued to be a yardstick that relatively few active managers could beat. 

  • Over the one-year period, 74% of funds were beaten by the S&P South Africa 50. The dominance of the large-cap benchmark is further highlighted by the 5- and 10-year periods, in which 95% of funds underperformed.
  • Versus the broader S&P South Africa DSW Capped Index, 47% of funds underperformed in the one-year period. This increases over time to 73% underperforming over the 10-year period.

The story is similar for fund managers when comparing performance on a risk-adjusted basis. Over the 10-year period, 89% and 66% of South African Equity funds underperformed the S&P South Africa 50 and S&P South Africa DSW Capped Index, respectively, on a risk-adjusted basis.

On an asset-weighted basis, South African Equity funds underperformed the S&P South Africa 50 by 1.7% over the one-year period, rising to 2.7% annualized underperformance over the 10-year period.  Compared with the broader S&P South Africa DSW Capped Index, fund managers fared better, collectively beating the benchmark by 2.6% and 1.2% over the one- and five-year periods, respectively.  Over the 10-year period, the same funds underperformed the benchmark by 0.3% annually. 

Global Equity

Over the one-year period, 89% of Global Equity funds in South Africa were outperformed by the S&P Global 1200; this figure rises to 97% over the 10-year period.  On a risk-adjusted basis, the strong level of fund outperformance persisted.  Over the 1-, 3-, 5-, and 10-year periods, 82%, 86%, 92%, and 100% of Global Equity funds, respectively, failed to beat the S&P Global 1200 on a risk-adjusted basis.

The notable performance of the S&P Global 1200 over Global Equity funds is best summarized by the fact that the 75th percentile fund in each of the 1-, 3-, 5-, and 10-year periods failed to outperform the benchmark.  In each of these periods, the funds underperformed by an annualized 3.0%, 1.8%, 1.9%, and 2.6%, respectively. 

pdf-icon PD F Download Full Article

SPIVA U.S. Year-End 2021

SUMMARY

Global equity markets powered ahead in 2021, despite the ongoing COVID-19 pandemic. As rocky vaccine rollouts and new coronavirus variants prolonged the pandemic, governments and central banks continued their strategies of generous fiscal spending and loose monetary policy. The S&P 500® gained 28.7% in 2021, capping an impressive 100.4% cumulative advance over the past three years.

The positive market performance translated into good absolute returns for active fund managers, although relative performance continued to disappoint: 79.6% of domestic equity funds lagged the S&P Composite 1500® in 2021.

SPIVA U.S. Year-End 2021: Graph 1

In 16 of the 18 categories tracking U.S. equities-focused funds, more than half the funds underperformed their benchmark. Particularly noteworthy were the 98.6% of large-cap growth funds that failed to beat the S&P 500 Growth—not only the worst-performing category in 2021, but the worst performing of any U.S. equities category in the past 21 years.

Large-cap funds continued their underperformance for the 12th consecutive calendar year, as 85% of active large-cap funds trailed the S&P 500. Mid-cap (62%) and small-cap (71%) funds acquitted themselves slightly better relative to the S&P MidCap 400® and S&P SmallCap 600®, but still offered scant reason to celebrate.

Fund managers often respond to evidence of active underperformance by claiming to offer better returns per unit of volatility (i.e., to outperform in risk-adjusted terms). This would be an appropriate counterargument, if only it were true. However, the data shows that the vast majority of actively managed funds underperformed on this metric as well. Among domestic equity funds, while 90% have underperformed the S&P Composite 1500 over the past 20 years, an even greater 95% did so on a risk-adjusted basis.

SPIVA U.S. Year-End 2021: Graph 2

For internationally focused U.S. funds, relative results in 2021 were a mixed bag. Most global (84%) and emerging markets (65%) funds failed to top the S&P Global 1200 and S&P/IFCI Composite, respectively. Investors in international (50%) and international small-cap (31%) funds were less likely to fall short of the S&P International 700 and S&P Developed Ex-U.S. SmallCap, respectively. Taking a longer view, however, nearly 85-90% trailed their benchmarks over the past 20 years, similar to their domestic counterparts.

While equity markets whistled past the inflation graveyard, the fixed income world started to price in the end of the easy money party. The Bloomberg Barclays US Government (1-3 Year), Intermediate, and Long indices returned -0.60% -1.69%, and -4.57% for the year, respectively. The funds charged with beating these benchmarks reflected this non-parallel movement in the rates term structure: government short funds had little chance (26%) of beating their hurdle rate, but intermediate (52%) and long (82%) funds took greater advantage of the lower bars they needed to clear.

Echoing the results from equities, longer observation horizons offered little sanctuary. More than 60% of funds did not surpass their benchmarks across all fixed income categories over the 15-year horizon on both an absolute and risk-adjusted basis.

The SPIVA Scorecard's accounting for survivorship bias continues to be a valuable cautionary tale. As has generally been the case in recent years, roughly 5% of funds across asset classes and categories were merged or liquidated in 2021. Over 20 years, nearly 70% of domestic equity funds and two-thirds of internationally focused equity funds across segments were confined to the history books. Similarly, roughly half of fixed income funds closed their doors over the past 15 years.

pdf-icon PD F Download Full Article

SPIVA Australia Year-End 2021

Contributor Image
Priscilla Luk

Managing Director, Global Research & Design, APAC

S&P Dow Jones Indices

Contributor Image
Tim Wang

Senior Analyst, Global Research & Design

S&P Dow Jones Indices

SUMMARY

  • S&P Dow Jones Indices has been the de facto scorekeeper of the ongoing active versus passive debate since the first publication of the SPIVA U.S. Scorecard in 2002. Over the past 20 years, we have built on our experience publishing the report by expanding scorecard coverage into Australia, Canada, Europe, India, Japan, Latin America, South Africa, and the MENA region.

  • The SPIVA Australia Scorecard reports on the performance of Australian active funds against their respective benchmark indices over different time periods. In this scorecard, we evaluate the returns of Australian large-cap equity funds, Australian mid-small cap equity funds, international equity funds, Australian bond funds, and Australian A-REIT funds.
  • In 2021, more than one-half of the funds in the Australian Equity General and Australian Equity Mid- and Small-Cap categories beat their respective benchmarks, though the majority of funds in the International Equity General, Australian Bonds, and Australian Equity A-REIT categories recorded smaller returns than their respective benchmarks.
  • There is no consistent trend in the yearly active versus index figures, but we have consistently observed underperformance for the majority of Australian active funds in most categories over the longer periods. Over the 5- and 10-year periods, the majority of active funds underperformed their respective benchmark indices across categories.
  • Active funds from all categories recorded aggregated liquidation rates of 25.5% and 40.9% for the 5- and 10-year periods, respectively. Australian Bonds funds had the lowest liquidation rates among all fund categories in those periods.

pdf-icon PD F Download Full Article

Processing ...