IN THIS LIST

Latin America Persistence Scorecard Mid-Year 2022

Canada Persistence Scorecard: Mid-Year 2022

Australia Persistence Scorecard: Mid-Year 2022

U.S. Persistence Scorecard Mid-Year 2022

SPIVA South Africa Mid-Year 2022

Latin America Persistence Scorecard Mid-Year 2022

Contributor Image
Anu R. Ganti

U.S. Head of Index Investment Strategy

S&P Dow Jones Indices

Contributor Image
Davide Di Gioia

Director, Index Investment Strategy

S&P Dow Jones Indices

SUMMARY

Can investment results be attributed to skill or luck? Genuine skill is more likely to persist, while luck is random and fleeting. Thus, one measure of skill is the consistency of a fund’s performance relative to its peers. The Persistence Scorecard measures that consistency and shows that, regardless of asset class or style focus, active management outperformance is typically relatively short-lived, with few funds consistently outranking their peers.

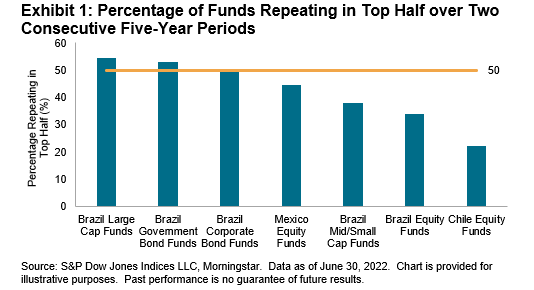
In each of our reported regional fund categories across Brazil, Chile and Mexico, of all the funds whose performance placed them in the top quartile for the 12-month period ending June 2018, less than 5% of all funds, and no equity funds, managed to remain in the top quartile for each of the next four years (see Report 2). Exhibit 1 illustrates that across most categories, less than 50% of funds were able to repeat their top-half status over two consecutive five-year periods (see Report 6).

Latin America Persistence Scorecard Mid-Year 2022: Exhibit 1

REPORT HIGHLIGHTS

Brazil

  • Top-performing Brazilian equity fund managers were unable to maintain their outperformance in subsequent years. Equity funds were the least persistent—by the fourth year, none of the funds in the Brazil Equity, Brazil Large-Cap and Brazil Mid-/Small-Cap categories had remained consistently in the top quartile (see Report 2).
  • Bond funds fared slightly better, but still the majority of corporate bond and government bond fund managers did not maintain consistent outperformance for five years in a row; only 3% of them did so (see Report 2).
  • The Brazil Corporate Bond Funds category was a highlight within the five-year transition matrix (see Report 5). The chance of a winning fund remaining in the top quartile after two consecutive five-year periods was the highest among all the categories, with 50% of funds remaining in the first quartile.

Chile

  • The lack of persistence by equity managers was equally visible in Chile—none of the top performing funds in the first 12-month period repeated their outperformance for the subsequent four years (see Report 2).
  • Report 3 shows that only 29% of the top-quartile funds in the first period of the three-year transition matrix remained in the top quartile at the end of the three years.
  • Funds in the second, third and fourth quartiles of the five-year transition matrix were more likely to be liquidated (44%, 44% and 67%, respectively) than to stay where they were or move to a higher-ranked quartile (see Report 5).

Mexico

  • Similar to the other regions, top-quartile managers in Mexico had difficulty replicating their outperformance in subsequent years. After one year, just 27% of managers remained in the top quartile, and after two years, none remained (see Report 2).
  • The five-year transition matrix shows that a third of top-quartile managers moved to quartile four over the five-year period, and only a third remained in the top (see Report 5).
  • Consistent with what we observed in the SPIVA® Latin America Mid-Year 2022 Scorecard, Mexico had a higher fund survival rate than Brazil and Chile across all periods measured. Reports 3, 4, 5 and 6 show that, on average, Mexican funds had less chance of being shut down than Brazilian and Chilean funds.

pdf-icon PD F Download Full Article

Canada Persistence Scorecard: Mid-Year 2022

Contributor Image
Joseph Nelesen, Ph.D.

Head of Specialists, Index Investment Strategy

S&P Dow Jones Indices

Contributor Image
Davide Di Gioia

Director, Index Investment Strategy

S&P Dow Jones Indices

Summary

Can investment results be attributed to skill or luck? Genuine skill is more likely to persist, while luck is random and fleeting. Thus, one measure of skill is the consistency of a fund’s performance relative to its peers. The Persistence Scorecard measures that consistency and shows that, regardless of asset class or style focus, active management outperformance is typically relatively short-lived, with few funds consistently outranking their peers.

Only days into 2022, a sustained downturn hobbled global markets. In this challenging environment, and in comparison to previous years, fewer top-quartile actively managed funds maintained their ranking over consecutive periods. Among all Canadian domestic equity funds ranked in the top quartile of performance over 12 months ending June 2020, zero maintained a top quartile position for the next two years.

Exhibit 1 shows the proportion of Canadian Equity managers who were in the top half of peer rankings as of June 2018 and remained in the top half over the following four years relative to what could be expected under a random distribution.

Canada Persistence Scorecard Mid-Year 2022: Exhibit 1

Report Highlights

− While slightly more than expected actively managed domestic equity funds maintained their quartile ranking over a few 12-month periods, the persistence of outperformance relative to their peers declined significantly over the five-year period ending June 2022.

− None of the actively managed domestic equity funds with top-quartile performance over the 12-month period ending June 2020 were able to maintain top-quartile performance over the subsequent two 12-month intervals. Global Equity and U.S. Equity similarly had no funds that maintained top-half performance over three 12-month periods. The only exception was International Equity, with 12% of funds staying in the top quartile over three consecutive 12-month intervals.

− Across a five-year horizon, evidence of persistent active fund outperformance was nonexistent. Within the group of active funds achieving top-quartile performance in their respective categories over the 12 months ending June 2018, not a single fund remained in the top quartile through each of the subsequent one-year periods ending in June 2022.

Over discrete five-year periods, a greater-than-expected proportion of funds in two domestic equity categories maintained relative outperformance. If performance was purely random in terms of comparing funds to their peers, one would expect 25% of top-quartile funds to remain in the top quartile in a subsequent period. Our scorecard reports that an unweighted average of 33% of top-quartile Canadian Equity and 32% of top-quartile Canadian Focused Equity funds remained in the top quartile for the two consecutive five-year periods.

− While liquidation was a more likely outcome for lower-ranked funds, style changes shared no strong relationship with underperformance. Over five-year horizons for all domestic equity categories, the highest rate of style changes (14%) occurred in Canadian Dividend and Income Equity funds in the first quartile. With the exception of fourth-quartile Canadian Small/Mid Cap Equity funds, all other lowest-quartile funds changed styles at an equal or lesser rate than higher quartiles.

pdf-icon PD F Download Full Article

Australia Persistence Scorecard: Mid-Year 2022

Contributor Image
Benedek Vörös

Director, Index Investment Strategy

S&P Dow Jones Indices

Contributor Image
Davide Di Gioia

Director, Index Investment Strategy

S&P Dow Jones Indices

Summary

Can investment results be attributed to skill or luck? Genuine skill is more likely to persist, while luck is random and fleeting. Thus, one measure of skill is the consistency of a fund’s performance relative to its peers. The Persistence Scorecard measures that consistency and shows that, regardless of asset class or style focus, active management outperformance is typically relatively short-lived, with few funds consistently outranking their peers.

Within each of our reported fund categories across Australian Equity General, Australian Equity Mid- and Small-Cap, International Equity General, Australian Bonds and Australian Equity A-REIT, among all the funds whose performance placed them in the top quartile for the 12 months ending June 2018, not a single fund managed to remain in the top quartile for the next four years.

On the other hand, lowering the bar from the top quartile to the top half yields tentative evidence of persistence among a fraction of funds within the Australian Bond funds category. As Exhibit 1 illustrates, 10% of active funds in that category were able to repeat their top-half status over four consecutive five-year periods.

Australia Persistence Scorecard Mid-Year 2022: Exhibit 1

Report Highlights

Very few actively managed equity, A-REIT and fixed income funds managed to maintain consistent outperformance relative to their peers over the three- or five-year periods ending in June 2022.

− Of the actively managed International Equity General, Bond and Equity A-REIT funds whose 12-month performance placed them in in the top quartile of their respective category as of June 2020, not a single fund maintained its top-quartile performance over the next two 12-month intervals.

Over a five-year horizon, it was statistically near impossible to find consistent outperformance. Among all actively managed funds whose performance over the 12 months ending June 2018 placed them in the top quartile within their respective category, in all of our reported categories, not a single fund remained in the top quartile in each of the five subsequent one-year periods ending in June 2022.

Over the long term, poor performance has proven to be a reliable indicator of future fund closures. Across the five categories reported by our scorecard, an unweighted average of 38% of actively managed funds whose performance placed them in the bottom quartile of performance in the five years ending in June 2017 were subsequently merged or liquidated over the next five years, while the comparable figure for funds whose performance placed them in the top quartile of performance of their category in the five years ending in June 2017 was just 14%.

pdf-icon PD F Download Full Article

U.S. Persistence Scorecard Mid-Year 2022

Contributor Image
Tim Edwards

Managing Director and Global Head of Index Investment Strategy

S&P Dow Jones Indices

Contributor Image
Anu R. Ganti

U.S. Head of Index Investment Strategy

S&P Dow Jones Indices

Contributor Image
Joseph Nelesen, Ph.D.

Head of Specialists, Index Investment Strategy

S&P Dow Jones Indices

Contributor Image
Davide Di Gioia

Director, Index Investment Strategy

S&P Dow Jones Indices

SUMMARY

Can investment results be attributed to skill or luck? Genuine skill is more likely to persist, while luck is random and fleeting. Thus, one measure of skill is the consistency of a fund's performance relative to its peers. The Persistence Scorecard measures that consistency and shows that, regardless of asset class or style focus, active management outperformance is typically relatively short-lived, with few funds consistently outranking their peers.

The first half of 2022 saw the winds change materially for investors across asset classes, with active fund persistence decreasing in comparison to previous reports. Within each of our reported domestic equity categories, among all the funds whose performance placed them in the top quartile for the 12 months ending June 2020, not a single fund managed to remain in the top quartile over the next two years.

Exhibit 1 illustrates the evolution of top-half persistence statistics over time for all actively managed domestic equity funds, compared to what might be expected under a random distribution.

U.S. Persistence Scorecard Mid-Year 2022 - Exhibit 1

Report Highlights

Very few actively managed equity and fixed income funds managed to maintain consistent outperformance relative to their peers over the three- or five-year periods ending in June 2022.

− Of the actively managed equity funds whose 12-month performance placed them in the top quartile of their respective category as of June 2020, not a single fund maintained its top-quartile performance over the next two 12-month intervals.

In 12 out of 17 reported fixed income categories, no actively managed fund managed to maintain top-quartile performance over three consecutive 12-month periods ending June 2022. In 14 out of 17 categories, less than 25% of funds whose three-year performance placed them in the top half of their category as of June 2020 managed to maintain their record over the subsequent two years.

− Over a five-year horizon, it was statistically near impossible to find consistent outperformance. Among all actively managed funds whose performance over the 12 months ending June 2018 placed them in the top quartile within their respective category, not one fund in any of our reported fixed income and equity categories remained in the top quartile in each of the four subsequent one-year periods ending in June 2022.

Over discrete three- and five-year periods, there was some evidence of persistence in relative outperformance in fixed income categories, but less so in equities. For purposes of comparison, 25% of top-quartile funds would be expected to remain in the top quartile in a subsequent period if performance was purely random. Our scorecard reports an unweighted average of 14% and 31% remaining in the top quartile, respectively, across equity and fixed income categories over the past two consecutive three-year periods, and equivalent figures of 18% and 30% over the past two consecutive five-year periods.

Poor performance continued to be a reliable indicator of future fund closures. For example, of the actively managed domestic equity funds whose performance placed them in the bottom quartile of performance over the five-year period ending in June 2017, more than 29% were subsequently merged or liquidated over the next five years. In fact, in every reported equity category, and in all but two of our reported fixed income categories, the worst-performing quartile over the previous five years saw the highest (or joint-highest) proportion of funds that were subsequently merged or liquidated over the next five years.

pdf-icon PD F Download Full Article

SPIVA South Africa Mid-Year 2022

Contributor Image
Joseph Nelesen, Ph.D.

Head of Specialists, Index Investment Strategy

S&P Dow Jones Indices

Contributor Image
Tim Edwards

Managing Director and Global Head of Index Investment Strategy

S&P Dow Jones Indices

Contributor Image
Davide Di Gioia

Director, Index Investment Strategy

S&P Dow Jones Indices

S&P Dow Jones Indices has been the de facto scorekeeper of the ongoing active versus passive debate since the first publication of the S&P Indices Versus Active (SPIVA) U.S. Scorecard in 2002.

The SPIVA South Africa Scorecard measures the performance of actively managed South African equity, global equity and fixed income funds denominated in South African rand (ZAR) against their respective benchmark indices over various time horizons. 

Mid-Year 2022 Highlights

In a tumultuous first half of 2022, many actively managed funds in South Africa deftly navigated falling markets. Less than one-half of active South African funds underperformed in each of the South Africa Equity (36% and 45% for large caps and the broad market, respectively), Short-Term Bond (34%) and Diversified/Aggregate Bond (23%) categories, while slightly more than one-half underperformed in the Global Equity category (52%). Underperformance rates generally increased with measurement horizons, with a cross-category average of 75% of active funds underperforming over the past 10 years.

SPIVA South Africa Mid-Year 2022: Exhibit 1

- South Africa Equity Funds: The S&P South Africa 50 fell 6.3% in H1 2022, while South Africa Equity funds lost 5.2% and 4.0% on equal- and asset-weighted bases, respectively, and 36% of funds underperformed the benchmark. Underperformance rates rose to 72%, 90% and 93% over the 3-, 5- and 10-year horizons, respectively. Compared to the S&P South Africa Domestic Shareholder Weighted (DSW) Capped Index, which dropped 5.3% in H1 2022, 45% of South Africa Equity funds underperformed. Over the 3-, 5- and 10-year horizons, underperformance rates climbed to 39%, 52% and 72%, respectively.

- Global Equity Funds: The S&P Global 1200 declined 17.2% during H1 2022, and Global Equity funds fell 18.1% and 17.9% on equal- and asset-weighted bases, respectively. Over the six-month period, 52% of funds in the category underperformed the benchmark. Over the 3-, 5- and 10-year periods, 92%, 96% and 96% of funds underperformed, respectively.

- Short-Term Bond Funds: The STeFI Composite climbed 2.2% in H1 2022, and 34% of Short-Term Bond funds underperformed the index. Funds in this category gained 2.2% and 2.1% on equal- and asset-weighted bases, respectively, over six months. Over the 3-, 5- and 10-year periods, 10%, 14% and 23% of funds underperformed, respectively. On a risk-adjusted basis, however, underperformance rates rose to 83%, 82% and 98% over the 3-, 5- and 10-year periods, respectively.

- Diversified/Aggregate Bond Funds: The S&P South Africa Sovereign Bond 1+ Year Index dropped 1.9% in the first six months of 2022, and 23% of Diversified/Aggregate Bond funds underperformed the index. Over the long term, 43%, 75% and 56% of funds underperformed over 3-, 5- and 10-year horizons, respectively.

- Fund Survivorship: Liquidation rates for all categories were in single digits for the one-year period ending June 30, 2022. The South Africa Equity fund category had the highest attrition rate, at 3.0%. Over the 10-year period, 39% of South Africa Equity funds merged or liquidated, and 31% of funds disappeared across all categories.

pdf-icon PD F Download Full Article

Processing ...