Summary
In this report, we add institutional accounts to the mutual funds analyzed in the S&P Indices versus Active (SPIVA) U.S. Scorecard. We aim to provide the institutional community with the ability to judge managers’ true skill without the possible distortions that fees may create and to illustrate the similarities and differences between the performance of open-end funds and segregated institutional accounts across categories.
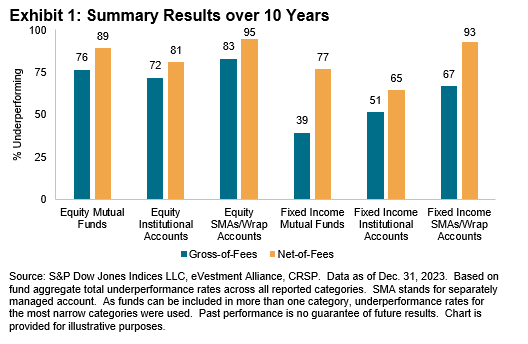
In this edition of our scorecard, we introduce wrap accounts to the purview of funds analyzed. Exhibit 1 shows that equity underperformance rates over the long term among institutional and wrap accounts are generally similar to those of mutual funds, with or without fees. More than 70% of funds across equity vehicles underperformed their respective benchmarks over the 10-year period ending Dec. 31, 2023. After deducting fees, underperformance rates increased above 80%. However, fees made a more significant difference across fixed income categories.

Report Highlights
Continuing the trend from prior years, 2023 demonstrated better long-term net-of-fees performance in institutional accounts than in mutual funds, with lower 10-year underperformance rates in 20 out of 21 reported equity segments (see Section I).
Shorter-term horizons show a broader range of outcomes. Within our most closely watched category of large-cap U.S. equity, 66% of institutional accounts and 72% of wrap accounts underperformed the S&P 500® in 2023 on a gross-of-fees basis, worse than the relatively benign result of 60% reported for their mutual fund peers (see Sections II and III). Mid- and small-cap managers fared better, particularly within the SMA/wrap space, with only 42% of mid-cap and 30% of small-cap wrap accounts underperforming their respective benchmarks. These accounts were perhaps aided by their ability to opportunistically tilt toward outperforming large caps.


