IN THIS LIST

Australia Persistence Scorecard: Year-End 2020

Latin America Persistence Scorecard: Year-End 2020

Canada Persistence Scorecard: Year-End 2020

U.S. Persistence Scorecard Year-End 2020

Europe Persistence Scorecard: Year-End 2020

Australia Persistence Scorecard: Year-End 2020

Contributor Image
Priscilla Luk

Managing Director, Global Research & Design, APAC

S&P Dow Jones Indices

Contributor Image
Tim Wang

Senior Analyst, Global Research & Design

S&P Dow Jones Indices

EXECUTIVE SUMMARY

  • While comparing active funds against their respective benchmark indices is a typical practice to evaluate their performance, persistence is an additional test that can reveal fund managers’ skills in different market environments.
  • In this report, we measure the performance persistence of active funds that outperformed their peers and benchmarks over consecutive three- and five-year periods, and we analyze their transition matrices over subsequent periods.
  • Overall results suggested only a minority of Australian high-performing funds persisted in outperforming their respective benchmarks or consistently stayed in their respective top quartiles for three or five consecutive years.

  • Over a consecutive three-year period, 27.5% of funds consistently maintained top-quartile rankings and 38.8% of funds consistently beat their benchmark.
  • Over a consecutive five-year period, only 1.0% of funds consistently maintained top-quartile rankings and 2.2% of funds consistently beat their benchmark.
  • Top-quartile and outperforming Australian funds did not show strong persistence over two non-overlapping three- and five-year periods, though they recorded lower liquidation rates.
  • Only 36.6% of funds maintained top-quartile rankings over two successive three-year periods and fewer (26.9%) did so for two successive five-year periods.
  • Among Australian funds that outperformed their benchmarks, 47.1% consistently beat their benchmarks consecutively over the three-year period and only 26.5% of them did so for the five-year period.

pdf-icon PD F Download Full Article

Latin America Persistence Scorecard: Year-End 2020

Contributor Image
María Sánchez

Director, Sustainability Index Product Management, U.S. Equity Indices

S&P Dow Jones Indices

INTRODUCTION

  • A key dimension of the active versus passive debate is managers' ability to consistently deliver above-average returns over multiple time periods. Persistence in performance is one of many possible ways to differentiate skill from luck.
  • In this report, we measure the performance persistence of active funds in Brazil, Chile, and Mexico that outperformed their peers over consecutive three- and five-year periods. We also analyze how their performance ranking transitioned over subsequent periods.

SUMMARY OF RESULTS

Brazil

  • Top performers in the fixed income fund categories showed better chances than equity categories to remain in the top quartile over three years (see Report 1).
  • Latin America Persistence Scorecard: Year-End 2020: Exhibit 1

  • Report 2 highlights the inability of top-performing equity fund managers to consistently repeat success in subsequent years. Large-cap fund managers showed the least persistence—by the fourth year none of them remained in the top quartile.
  • Within the Brazil Corporate Bond Funds category, only 15% were able to maintain consistent outperformance for five years in a row. Brazil Government Bond Fund managers had somewhat better results; 22% of them delivered consistent outperformance for five years in a row (see Report 2).
  • The five-year transition matrix (see Report 5) highlights the Brazil Equity Fund and Brazil Government Bond Fund categories. The chance of a winning fund remaining in the top quartile after five one-year periods was lower than the chance of it liquidating.
  • More than half (57%) of the top-quartile funds in the Brazil Corporate Bond Funds category remained in the top quartile, and the rest were merged or liquidated by the end of the five-year period (see Report 5).

Chile

  • Report 2 shows a lack of persistence among equity managers in Chile—only 20% of top performing funds in the first 12-month period repeated their outperformance after three years. None of the top-performing funds persisted in the subsequent periods.
  • Top-quartile managers' funds in the first period of the five-year transition matrix were more likely to be liquidated (67%) than to stay in the first quartile (22%) or move to lower quartiles (11%). Lack of resilience also characterized managers who started in the subsequent quartiles (see Report 5).

Mexico

  • As observed in the SPIVA® Latin America Year-End 2020 Scorecard, Mexico had a higher rate of fund survivors than Brazil and Chile in the three-year and five-year periods. Reports 3, 4, 5, and 6 show that Mexican funds had a lower chance of being shut down than Brazilian and Chilean funds.
  • The five-year performance persistence test (see Report 2) shows that top-quartile managers had difficulty replicating their outperformance in subsequent years. After one year, just 36% of managers remained in the top quartile, and by the end of year two, none remained.
  • Report 5 shows that top-quartile managers in the first five-year period survived in the second five-year period; however, they were more likely to move to quartile three or four than remain in the top.

pdf-icon PD F Download Full Article

Canada Persistence Scorecard: Year-End 2020

Our widely followed SPIVA® Canada Scorecard has consistently shown that most Canadian active managers underperform their benchmarks most of the time. However, if an active manager beats a benchmark, how do we know whether the result is a product of genuine skill or merely of good luck? One key is that genuine skill is likely to persist, while luck is random and can soon dissipate.

The Canada Persistence Scorecard attempts to distinguish luck from skill by measuring the consistency of active managers’ success. It shows that regardless of asset class or style focus, active management outperformance is typically short lived, with few funds consistently outranking their peers.

For example, of the 144 funds that ranked in the top quartile of their respective style category in 2016, just one fund remained in the top quartile annually through 2020. In fact, observed over a longer timeframe, Exhibit 1 shows that the top-quartile Canadian Equity funds for 2011-2015 were more likely to revert to the bottom quartile for 2016-2020 (see Reports 2 and 5).

Canada Persistence Scorecard Year-End 2020: Exhibit 1

pdf-icon PD F Download Full Article

U.S. Persistence Scorecard Year-End 2020

SUMMARY

Can investment results be attributed to skill or luck?  Genuine skill is likely to persist, while luck is random and fleeting.  Thus, one measure of skill is the consistency of a fund’s performance relative to its peers.  The Persistence Scorecard measures that consistency and shows that, regardless of asset class or style focus, active management outperformance is typically short-lived, with few funds consistently outranking their peers.

Compared to previous years, active fund persistence somewhat improved in 2020.  For example, 64.5% of domestic equity funds in the top half of the distribution for 2018 continued in the top half in 2019, and 55.0% repeated that feat in 2020.  At first glance, this lends some credence to the idea of persistent outperformance (see Report 1).

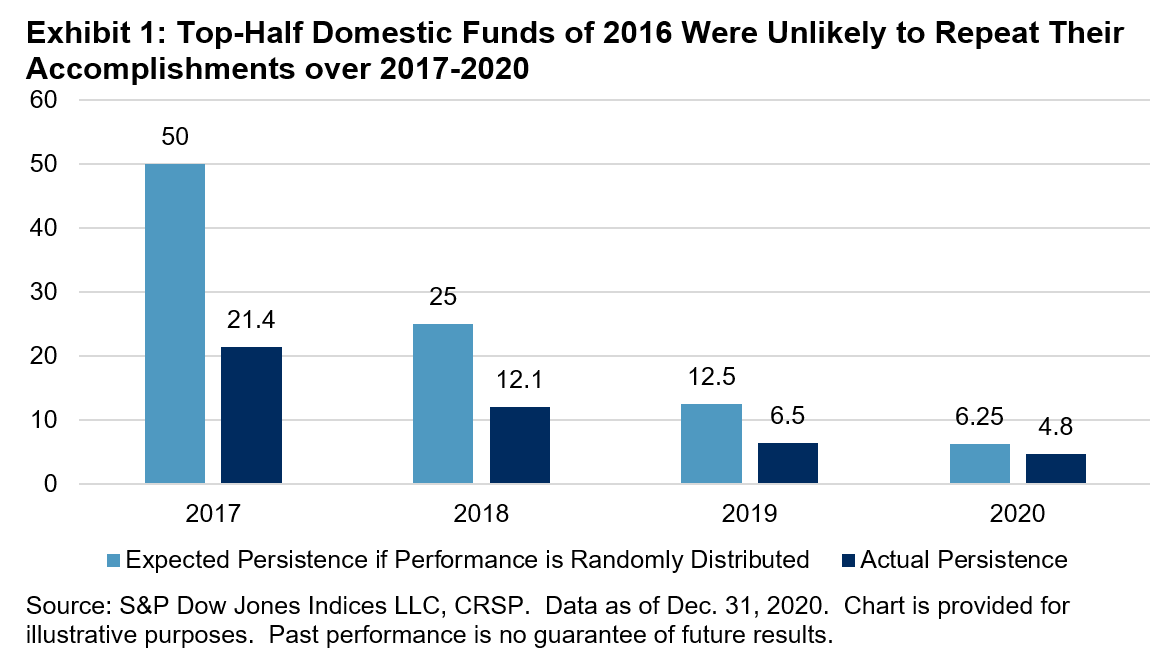
However, rewind the clock two years, and of the top-half funds of 2016, 21.4% repeated that accomplishment in 2017, with just 4.8% ranking in the top half each year through 2020.  This rate is lower than what random chance would predict (see Exhibit 1 and Report 2).

U.S. Persistence Scorecard Year-End 2020: Exhibit 1

This difference in persistence over three- and five-year windows was also visible in top-quartile funds.  Of the top-quartile domestic equity funds in 2018, 33.7% managed to stay in the top quartile annually through 2020.  In fact, in every equity category, more than 25% of 2018’s top-quartile funds stayed in the top quartile annually through 2020.  Looking at 2016’s top-quartile funds paints a different picture: even in the best-performing category, mid-cap funds, only 1.5% of funds managed to stay in the top quartile annually through 2020 (see Reports 1 and 2).

Some statistically minded readers might note that these numbers are better than what would be expected if fund performance was randomly distributed.  For example, the odds that a fund could remain in the top quartile for four consecutive years might be calculated as (25%)4 = 0.39%, and the 1.5% referenced above is substantially better than that.  While the persistence report does not prove that fund performance is completely random, from a practical or decision-making perspective, it reinforces the notion that choosing between active funds on the basis of previous outperformance is a misguided strategy.  After all, there remains a 98.5% chance that a top-quartile fund will not stay in the top quartile for the next four years. 

Lengthening the horizon to consider performance over two consecutive five-year periods, the top-half domestic equity funds in the 2011-2015 period had little luck maintaining their top-half status for the 2016-2020 period.  In fact, the chances of a top-half fund changing style or liquidating (39.8%) nearly matched the odds of remaining in the top half (41.0%) (see Report 6).

Unsurprisingly, the one pattern that did hold across equity funds was the tendency of the poorest funds to close.  Fourth-quartile funds were the most likely to merge or liquidate over the subsequent three- and five-year windows, with 40.6% of the bottom-quartile mid-cap funds from the 2011-2015 period disappearing by 2020.  In fact, closing their doors was the most likely outcome in four out of five equity categories for fourth-quartile funds in that period (see Report 5).

pdf-icon PD F Download Full Article

Europe Persistence Scorecard: Year-End 2020

Contributor Image
Andrew Innes

Head of Global Research & Design

S&P Dow Jones Indices

Contributor Image
Andrew Cairns

Senior Director, Global Research & Design

S&P Dow Jones Indices

INTRODUCTION

For the first time, we are introducing the Europe Persistence Scorecard, differentiating skill from luck by examining the ability of active European equity funds to consistently outperform their peers and their benchmark.  This scorecard looks to support the well-known disclaimer that past performance is not indicative of future results and that oftentimes an investor would have better success in selecting a fund at random rather than from a group of top performers.

In this report, we pose two questions: did top funds stay ahead of the pack, and did outperforming funds continue to outperform their benchmark?  In summary, active funds were generally less able to persistently outperform their benchmark than they were their peers.

PERSISTENCE – DID THE TOP FUNDS STAY AHEAD OF THE PACK?

Pan-European Equity Funds: Over the shorter term, Report 1 indicates that there may have been some predictability by selecting a top-quartile Europe Equity fund.  The percentage of funds that remained in the top quartile for three consecutive 12-month periods was 15.8%, far higher than what would have been expected from selecting a fund at random (0.252 = 6.25%).

This notion is not further substantiated after viewing the performance persistence over five consecutive 12-month periods (see Report 2).  The percentage of funds that did so was 0.41%, close to what would have been expected from a random draw (0.254 = 0.39%).

Europe Persistence Scorecard: Year-End 2020: Exhibit 1

A similar picture is evident when observing the persistence of funds remaining in the top half of their fund category group.  From Report 2, the percentage of funds that remained in the top half for four more years was 5.14%; this is lower than what would be expected from selecting a fund at random.  The probability of that fund remaining in the top half for four consecutive years is 0.54 = 6.25%.

However, when measuring performance over longer windows (rather than measuring persistence over more consecutive periods), the transition matrices in Report 3 and 5 again show evidence that supports persistence.  41.3% of top quartile European funds repeated their ability to position in the top quartile when observing two consecutive three-year windows, and up to 42.0% did so when observing five-year windows.

Other Equity Funds in Europe: From the remaining five equity fund categories, Global Equity, U.S. Equity, and U.K. Equity also displayed a higher degree of persistence of funds remaining in the top quartile for three consecutive 12-month periods than would otherwise be expected from a random selection.  However, only Global Equity and U.K. Equity funds demonstrated a better-than-random persistence on the same basis over five consecutive 12-month periods.  Strikingly, none of the funds in Eurozone Equity, Emerging Markets Equity, or U.S. Equity were able to deliver five consecutive top-quartile rankings.

pdf-icon PD F Download Full Article

Processing ...