


Summary
Can investment results be attributed to skill or luck? Genuine skill is more likely to persist, while luck is random and fleeting. Thus, one measure of skill is the consistency of a fund’s performance relative to its peers. The Persistence Scorecard measures that consistency and shows that, regardless of asset class or style focus, active management outperformance is typically relatively short-lived, with few funds consistently outranking their peers.
Within each of our reported fund categories across Australian Equity General, Australian Equity Mid- and Small-Cap, International Equity General, Australian Bonds and Australian Equity A-REIT, among all the funds whose performance placed them in the top quartile for the 12 months ending June 2018, not a single fund managed to remain in the top quartile for the next four years.
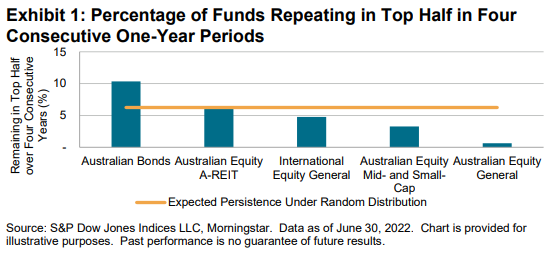
On the other hand, lowering the bar from the top quartile to the top half yields tentative evidence of persistence among a fraction of funds within the Australian Bond funds category. As Exhibit 1 illustrates, 10% of active funds in that category were able to repeat their top-half status over four consecutive five-year periods.
Report Highlights
− Very few actively managed equity, A-REIT and fixed income funds managed to maintain consistent outperformance relative to their peers over the three- or five-year periods ending in June 2022.
− Of the actively managed International Equity General, Bond and Equity A-REIT funds whose 12-month performance placed them in in the top quartile of their respective category as of June 2020, not a single fund maintained its top-quartile performance over the next two 12-month intervals.
− Over a five-year horizon, it was statistically near impossible to find consistent outperformance. Among all actively managed funds whose performance over the 12 months ending June 2018 placed them in the top quartile within their respective category, in all of our reported categories, not a single fund remained in the top quartile in each of the five subsequent one-year periods ending in June 2022.
− Over the long term, poor performance has proven to be a reliable indicator of future fund closures. Across the five categories reported by our scorecard, an unweighted average of 38% of actively managed funds whose performance placed them in the bottom quartile of performance in the five years ending in June 2017 were subsequently merged or liquidated over the next five years, while the comparable figure for funds whose performance placed them in the top quartile of performance of their category in the five years ending in June 2017 was just 14%.
