IN THIS LIST

Worth the Weight

Natural Selection: Tactics and Strategy with Equity Sectors

ETFs in Insurance General Accounts – 2024

ETFs in Asset Owner Portfolios – Q1 2024

Exploring China A-Share Dividends and High Yield Strategy Performance

Worth the Weight

Contributor Image
Tim Edwards

Managing Director and Global Head of Index Investment Strategy

S&P Dow Jones Indices

Contributor Image
Anu R. Ganti

U.S. Head of Index Investment Strategy

S&P Dow Jones Indices

Contributor Image
Hamish Preston

Head of U.S. Equities

S&P Dow Jones Indices

“It takes 500 small details to add up to one favorable impression."

Cary Grant

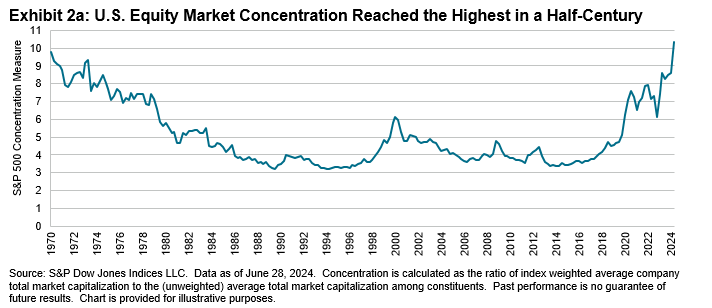
The S&P 500® Equal Weight Index has outperformed the S&P 500® over more than two decades of live history, with a similar long-term rate of excess returns observed over a hypothetical back-tested history extending back to 1970 (see Exhibit 1).  These observations are not new, but an equal weight approach to large-cap U.S. equities may be of particular interest in times such as the present, when the equity markets are at high levels of market concentration relative to history.

In the context of the current market dynamics, this paper summarizes a wide range of observations on the potential sources and drivers of relative performance in the S&P 500 Equal Weight Index—ranging from market concentration to sector, factor and single-stock perspectives.

Worth the Weight: Exhibit 1

The Current Market Context

The U.S. equity market has, among other features, been recently characterized by strongly extended price trends and the relative dominance of a few mega-cap companies.  This could make equal weight strategies particularly interesting because, first, trends in concentration and momentum tend to reverse at some point (even if it is hard to identify when that will occur) and second, because diversification strategies can be more important when markets are relatively concentrated.

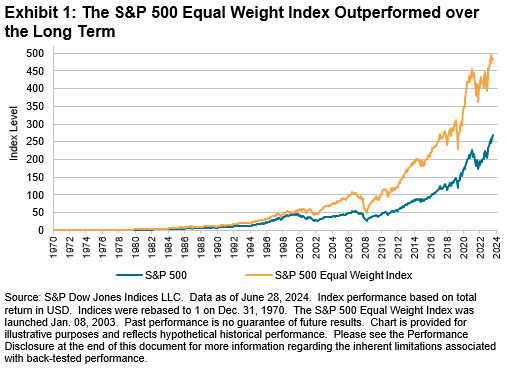
There are numerous ways to see that the U.S. equity market is unusually concentrated at present. Particularly germane to comparisons between equal- and market-cap-weighted indices is that as of June 28, 2024, the (unweighted) average market capitalization of the S&P 500 constituents was USD 96.3 billion dollars but, in contrast, the index-weighted average market capitalization was USD 998.6 billion dollars.  In other words, a strategy tracking the S&P 500 would—on a portfolio-weighted basis—have an average market capitalization more than ten times larger than an equally weighted one.

Using this ratio (between the weighted and unweighted average market cap) to represent “concentration,” we can see that concentration has risen sharply over the past 10 years, recently reaching extremes not seen for more than half a century (see Exhibit 2a).

Worth the Weight: Exhibit 2

pdf-icon PD F Download Full Article

Natural Selection: Tactics and Strategy with Equity Sectors

Contributor Image
Joseph Nelesen, Ph.D.

Head of Specialists, Index Investment Strategy

S&P Dow Jones Indices

Contributor Image
Tim Edwards

Managing Director and Global Head of Index Investment Strategy

S&P Dow Jones Indices

In recent years, the S&P 500® sectors have exhibited elevated dispersion, including their widest-ever spread between the best and worst performers in 2022, highlighting an opportunity for studying the impact of sector selection (see Exhibit 1). In a rapidly evolving global investment landscape, S&P 500 sectors remain tools in active and passive portfolio construction and worthy of consideration.

In this paper, we will:

  • Review sector characteristics, performance and influence on stock returns;
  • Evaluate the impact of skew on active selection of stocks, sectors and industries;
  • Present case studies on strategic and tactical portfolio applications of sector indices.

S&P 500 Sector Best-Worst Total Return Spread (Annual): Exhibit 1

1. Introduction

“Look deep into nature, and then you will understand everything better.”

Albert Einstein

Imagine equity markets as a deep rainforest, grown dense through the centuries with new ways of investing, constantly born out of soil made from those that came and went long before. Teeming with life and ripe for exploration, this nested series of complex systems perpetually lures intrepid investors seeking answers to the questions: What features drive the behavior of a stock, and how can those help us make sense of the world?  As colorful and novel species in this evolving landscape attract the adventurer’s curiosity, so too should a curiously old and large tree with many branches found towering above the canopy.  Like sectors, this tree not only endures, but also remains intertwined with the ecosystem of stocks that surround it, providing clues on how to thrive in constantly evolving conditions.

In this paper, we explore how the enduring power of sectors and industries helps to define markets and serve as the framework for myriad investing strategies.  Just as the allure of active stock selection persists, so too does evidence that outperformance relative to indices is elusive.  Decades of data suggest that sectors and industries may sometimes be more effective exposures than single stocks to diversify risk and express views on market and economic conditions around the world. 

We will review past performance of sectors through the lens of 21st century market cycles, identify consistent patterns that continue to make sectors useful and highlight the potential of sectors to improve diversification and performance in global portfolios.

Sectors and industries concentrate securities with similar business models and risk factors, aligning company types around characteristics that largely transcend borders and make them relevant for investors worldwide. The growing use of sectors and industries among diverse investor types in a wide and growing array of liquid index-based strategies and holding periods is reflected in asset levels for related exchange-traded funds (ETFs; see Exhibit 2).  This paper examines historical sector and industry index performance and tests strategic long-term use of one or more sectors to gain consistent exposure or correct an unintended bias, as well as tactical use with the intent of adjusting allocations depending on market or economic conditions.  The outcomes reaffirm the enduring power of sectors and industries as building blocks in modern equity allocations.

pdf-icon PD F Download Full Article

ETFs in Insurance General Accounts – 2024

Contributor Image
Kelsey Stokes

Sales Head, Insurance

S&P Dow Jones Indices

Contributor Image
Anu R. Ganti

U.S. Head of Index Investment Strategy

S&P Dow Jones Indices

Introduction

In 2023, U.S. insurers held USD 34.4 billion in exchange-traded funds (ETFs).  For the second year in a row, we saw large outflows from large insurers.  In 2022, the bear market exacerbated the outflows to decrease AUM by 23%.  In 2023, the market acted against the outflows and AUM only decreased by 6%.

One company selling fixed income ETFs accounted for 50% of the outflows.  These outflows accounted for most of the fixed income outflows.  A more diversified set of companies selling equities accounted for the other half of the outflows.  The combined outflows over 2022 and 2023 has altered the profile of ETF holdings by insurers.  In our ninth annual study of ETF usage by U.S. insurance general accounts, we review ETF usage across various types of companies and across different asset classes.  We also analyze how trading patterns have varied over the years.

Holding Analysis

As of year-end 2023, U.S. insurers invested USD 34.4 billion in ETFs.  This is a fraction of the USD 8.1 trillion in U.S. ETF AUM, as well as the USD 8.4 trillion in insurance general account assets.  Exhibit 1 shows the use of ETFs by U.S. insurers over the past 20 years.

ETFs in Insurance General Accounts – 2024 : Exhibit 1

pdf-icon PD F Download Full Article

ETFs in Asset Owner Portfolios – Q1 2024

Contributor Image
Marcus Friedman

Director, Head of Asset Owners Channel

Introduction

For more than a decade, pensions, endowments, foundations and sovereign wealth funds—collectively “asset owners”—have invested in exchange-traded funds (ETFs).  Initially, they invested only minimal amounts.  However, starting in 2017, plans began to slowly increase their ETF usage.  Then, in Q4 2019, these plans suddenly increased their use of ETFs.  The onset of COVID-19 and the resulting financial crisis resulted in asset owners greatly increasing their ETF usage.

In our initial analysis of U.S. and Canadian asset owners, we used 13F filings to analyze ETF holdings and trends in these investments.  In 2023, asset owner ETF AUM increased 22%, to USD 56 billion.  Over the past 10 years, ETF usage has increased 4x, with most of that growth coming in the past three years.  During the same period, the number of asset owners using ETFs nearly doubled and the number of ETFs used increased more than 3.5x.

Holding Analysis

As of year-end 2023, asset owners had USD 56 billion invested in ETFs.  Exhibit 1 shows the growth of ETFs over the past 10 years.  ETF usage began increasing in December 2016.  Then, between Q3 and Q4 2019, ETF AUM doubled.

ETF AUM Growth: Exhibit 1

After peaking at the end of 2021, AUM dropped, mostly on valuation.  However, in 2023, ETF usage again increased, and AUM grew by 22% (see Exhibit 2).  Since 2018, when plans began to use ETFs in a material way, the compound annual growth rate (CAGR) has averaged 28%, implying a doubling of AUM every 2.85 years (see Exhibit 3).

CAGR of ETF AUM: Exhibit 2

pdf-icon PD F Download Full Article

Exploring China A-Share Dividends and High Yield Strategy Performance

Contributor Image
Jason Ye

Director, Factors and Thematics Indices

S&P Dow Jones Indices

Contributor Image
Izzy Wang

Senior Analyst, Factors and Dividends

S&P Dow Jones Indices

Introduction

Dividend indices stand as one of the most recognized factor-based investment strategies. As of year-end 2023, there were 377 dividend-focused exchange-traded products (ETPs) globally, amassing over 500 billion in assets under management (AUM). In the China A-shares market, the dividend strategy surged to prominence as 2024 kicked off, exhibiting robust performance amidst recent market turbulence. With an AUM increase of over CNY 20 billion in 2023, dividends have emerged as the primary factor strategy in China's ETF industry.

This paper undertakes a comprehensive examination of the Chinese dividend market, providing insights into the historical performance of the high dividend yield strategy.

Dividends in the China A-Share Market

Cash dividends may serve as a significant indicator of a company’s future prospects and governance discipline, particularly in developed markets. However, in the China A-shares market, companies have historically displayed reluctance to distribute profits to shareholders, opting instead to retain earnings for reinvestment. Stock dividends once dominated the market, garnering substantial interest from retail investors. This phenomenon underscored a corporate emphasis on refinancing while neglecting the distribution of earnings to shareholders.

In response to the need to enhance shareholder rewards and corporate governance, Chinese authorities introduced a series of dividend encouragement policies.  The China Securities Regulatory Commission (CSRC), for instance, raised the minimum cash dividend payout level to 30% in 2008, compelling companies to distribute profits.  Concurrently, the State Administration of Taxation (SAT) gradually reduced taxes on dividends to encourage public investment in dividend-paying stocks.  The reduction in personal income tax on dividends from 20% to 10% in 2005, further lowered to 5% in 2013 and eventually eliminated in 2015, incentivized investors to hold stocks for more than one year.  In 2023, the CSRC issued a "cash dividend guidance for publicly listed companies," urging clarity in dividend policies and stabilization of investor expectations.  The document also reiterated the importance of a 30% dividend payout ratio, and encouraged companies to start paying interim dividends. These policies played a pivotal role in fostering a cash dividend culture in the China A-share market.

As of Dec. 31, 2023, the trailing 12-month dividend yield of the S&P China A Domestic BMI stood at 1.97%, aligning with the dividend yield level of the S&P Developed BMI and surpassing that of the S&P 500® (see Exhibit 1).  Indexed assets tracking dividend strategies in the China A-shares market surged from CNY 2 billion in 2013 to CNY 42 billion by Dec. 31, 2023, reflecting an impressive annualized compound annual growth rate (CAGR) of 36% (see Exhibit 2).  Moreover, the number of dividend funds tripled over the past four years.

Exploring China A-Share Dividends and High Yield Strategy Performance: Exhibit 1

Exploring China A-Share Dividends and High Yield Strategy Performance: Exhibit 2

pdf-icon PD F Download Full Article

Processing ...