IN THIS LIST

The S&P/B3 Ingenius Index: Bringing Global Innovation to the Brazilian Market

Net Zero and Broad ESG in One Index

Effectively Measuring Mega Caps: The S&P 500 Top 50

ETFs Turn 20 in Australia: How the S&P/ASX Series Propelled the Growth of Index Investing

The S&P IPSA ESG Tilted Index: A New Benchmark for Measuring Sustainability in Chile

The S&P/B3 Ingenius Index: Bringing Global Innovation to the Brazilian Market

Contributor Image
Silvia Kitchener

Director, Global Equity Indices, Latin America

S&P Dow Jones Indices

INTRODUCTION

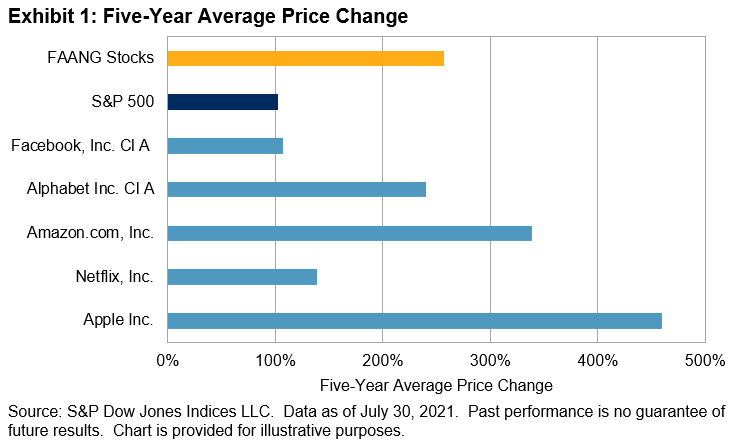
Over the past five years, the world witnessed the dramatic rise in the market capitalization of technology-driven companies like Facebook, Amazon, Apple, Netflix, and Google (now Alphabet), collectively known as the FAANG stocks. The growth rates of these stocks over the past five years have been quite remarkable, with the average price change exceeding 250% and outperforming the S&P 500® by 15.5% (see Exhibit 1).

On May 11, 2020, S&P Dow Jones Indices (S&P DJI) and B3 introduced the S&P/B3 Ingenius Index to the Brazilian market. The index seeks to measure the performance of global companies creating many of the innovative products and services that permeate today’s modern world and are transforming almost every aspect of daily life, including the way we communicate, work, entertain, and shop, and nearly everything in between.
By launching the S&P/B3 Ingenius Index, S&P DJI is providing an index that is designed to measure the performance of 15 innovative global companies trading on B3 as Brazilian Depositary Receipts (BDRs), giving local investors access to foreign securities.

The S&P/B3 Ingenius Index: Bringing Global Innovation to the Brazilian Market: Exhibit 1

pdf-icon PD F Download Full Article

Net Zero and Broad ESG in One Index

EXECUTIVE SUMMARY

  • The S&P PACT Indices now use the S&P DJI ESG Scores, exclude companies based on more business activities, and include a buffer rule and revised stock cap.
  • The changes mean that choosing between a broad ESG index and a net zero/1.5°C-aligned index is no longer necessary.
  • The S&P 500 PACT Indices show excess return historically, which can be largely explained by factor and sector exposures.

INTRODUCTION

Over the year since the launch of the S&P PACT Indices, the market has pushed for an index methodology evolution: the addition of an S&P DJI ESG Score improvement, further exclusions, a buffer rule, and revised stock capping (see Exhibit 1).  The series comprises two types of indices: the S&P Climate Transition (CT) Indices and their more ambitious cousins, the S&P Paris-Aligned (PA) Indices.  Both of these index series are aligned with the EU’s minimum standards for low carbon benchmarks under the EU Benchmark Regulation, which follow a 1.5°C scenario toward net zero by 2050, thus the name change to include “Net Zero 2050.”  These methodology changes mean investors no longer need to choose between broad ESG indices and net zero/1.5°C-compatible indices—a first for the market.

In this paper, we outline how these methodology enhancements modify the index composition and the differences between the S&P CT and PA Indices, compare to the previous methodology, and provide a brief analysis of exposures and historical performance.

Net Zero and Broad ESG in One Index: Exhibit 1

pdf-icon PD F Download Full Article

Effectively Measuring Mega Caps: The S&P 500 Top 50

Contributor Image
Hamish Preston

Head of U.S. Equities

S&P Dow Jones Indices

U.S. mega-caps have become increasingly important in driving equity returns in recent years amid outperformance from some of the largest companies. Given the elevated importance of U.S. mega-caps in recent years, this paper provides an overview of the S&P 500 Top 50®, which seeks to measure the performance of mega-cap U.S. equities by selecting the largest 50 companies in the S&P 500, annually. Specifically, this paper:

• Highlights the potential relevance of U.S. mega-caps;
• Outlines the S&P 500 Top 50's construction, and analyzes the index's historical risk/return characteristics, and;
• Shows how incorporating U.S. mega-caps could help investors alleviate domestic sector biases.

Exhibit 1 shows that S&P 500 Top 50 constituents accounted for around 45% of the U.S. equity market, as represented by the S&P Total Market Index (TMI), at the end of July 2021. This figure ranked in the top 5% of month-end readings since June 2005 and was far above the long-term average of 40%.

Effectively Measuring Mega Caps: The S&P 500 Top 50: Exhibit 1

POTENTIAL RELEVANCE OF U.S. MEGA-CAP COMPANIES TO GLOBAL INVESTORS

The breadth and depth of the U.S. equity market means that trends affecting U.S. companies will be relatively important in driving global equity returns. For example, U.S.-domiciled companies accounted for 57% of the weight of the S&P Global BMI as of July 30, 2021, nearly 8.5 times larger than the index's second-largest country, Japan.

Exhibit 1 showed that mega-cap companies represent a sizeable portion of the U.S. equity market. Exhibit 2 reinforces this point by comparing the float market capitalization of the S&P TMI and its component indices, as of July 30, 2021. While smaller U.S. equity indices are as large as certain S&P Global BMI countries, S&P 500 Top 50 constituents are an order of magnitude larger.

Effectively Measuring Mega Caps: The S&P 500 Top 50: Exhibit 2

Perhaps unsurprisingly, U.S. mega-cap companies can have an outsized impact on global equity returns and measuring their performance may help to identify prevailing market narratives. This is especially the case for certain global equity sectors: Exhibit 3 shows that U.S. companies account for the majority of the float market capitalization in most S&P Global BMI sectors, and U.S. mega-cap companies account for a sizeable proportion of this weight.

Effectively Measuring Mega Caps: The S&P 500 Top 50: Exhibit 3

pdf-icon PD F Download Full Article

ETFs Turn 20 in Australia: How the S&P/ASX Series Propelled the Growth of Index Investing

Contributor Image
Sherifa Issifu

Senior Analyst, U.S. Equity Indices

S&P Dow Jones Indices

Contributor Image
Michael Orzano

Head of Global Exchanges Product Management

S&P Dow Jones Indices

Since its debut in April 2000, the S&P/ASX Index Series has helped to define the Australian equity market. As Australia’s most widely followed market indicator, the S&P/ASX 200 serves as the de facto measure of the value and performance of the nation’s stock market. Market peaks and valleys are defined by the level of the S&P/ASX 200.


Beyond the headlines, however, the index series serves an integral role in Australia’s investment infrastructure. For example, the fund  anagement industry utilizes the S&P/ASX 200 and other S&P/ASX Indices to serve as the investable universe for active investment strategies and to benchmark fund performance. Likewise, asset owners, such as superannuation funds, use S&P/ASX Indices to benchmark their domestic
portfolios. With an estimated AUD 319 billion1 in Australian equity funds benchmarked to S&P/ASX Indices, the series represents by far the most widely used benchmarks for Australian investment funds.

Perhaps most importantly, the S&P/ASX Index Series has served as the foundation for the growth of indexbased investing in Australia, including
the nation’s first exchange-traded fund (ETF). The deep ecosystem of liquid financial products tracking key S&P/ASX Indices allows active and passive investors to express investment views in an efficient manner. S&P Indices Versus Active (SPIVA®) research has also shined a light on the inability of most Australian fund managers to beat their benchmarks, further highlighting the benefits of passive investing. As has occurred in other parts of the world, the growth of index investing has democratized investment solutions that were previously only available to large institutions and lowered the cost of investing for millions of Australians.

pdf-icon PD F Download Full Article

The S&P IPSA ESG Tilted Index: A New Benchmark for Measuring Sustainability in Chile

Contributor Image
María Sánchez

Director, Sustainability Index Product Management, U.S. Equity Indices

S&P Dow Jones Indices

Contributor Image
Cristopher Anguiano

Senior Analyst, U.S. Equity Indices

S&P Dow Jones Indices

INTRODUCTION

Indices that integrate environmental, social, and governance (ESG) data are moving from the margins to the mainstream, as market participants increasingly seek to align their values with their investments.  A new type of ESG index is emerging to facilitate this change in Chile: the S&P IPSA ESG Tilted Index.  Jointly developed by S&P Dow Jones Indices (S&P DJI) and the Santiago Stock Exchange (BCS or Bolsa de Comercio de Santiago), this index not only highlights strong ESG companies, it also enables allocation to such companies while aiming to limit major risks relative to the market.

THE EVOLUTION OF ESG INDICES

In 1999, S&P DJI launched the first global ESG index, the Dow Jones Sustainability™ World Index (DJSI World).  It includes the top 10% of companies, industry by industry, according to their ESG performance, as determined by the Corporate Sustainability Assessment (CSA) conducted by S&P Global.  This groundbreaking index encouraged companies to incorporate many ESG factors in their decisions, extending them beyond short-term financial considerations.

In the years that followed, other indices, including regional versions of the DJSI World such as the DJSI Emerging Markets, were launched with this same philosophy in mind: to highlight best-in-class companies and thereby inspire firms to improve their ESG approaches in order to qualify for inclusion in these indices.

Though these indices have been successful and have indeed inspired companies to change in positive ways, aspects of their methodologies may present challenges for many investors.  Some strategies can be too narrow for investors who want to remain broadly diversified.  Though many high-conviction market participants use the narrow, best-in-class indices for investment, we saw a need for ESG indices more in line with the broader market, while providing a more sustainable portfolio of companies.  

pdf-icon PD F Download Full Article

Processing ...