IN THIS LIST

The iBoxx USD Liquid Emerging Markets Sovereigns & Sub-Sovereigns: A New Tool for the Emerging Market Bond Ecosystem

FAQ: S&P Dow Jones Indices’ June 2024 Quarterly Rebalance of the Technology Select Sector Index

Spotlight on Asian Credit – An Index Perspective

The Evolving Growth Story of China's Economy: The S&P China Consumption Index

Introducing the S&P Sustainable Development Goals Indices

The iBoxx USD Liquid Emerging Markets Sovereigns & Sub-Sovereigns: A New Tool for the Emerging Market Bond Ecosystem

Contributor Image
Catalina Zota

Associate Director, Fixed Income Product Management

S&P Dow Jones Indices

Contributor Image
Nicholas Godec

Senior Director, Head of Fixed Income Tradables & Private Markets

S&P Dow Jones Indices

Executive Summary

The iBoxx USD Liquid Emerging Markets Sovereigns & Sub-Sovereigns index tracks the performance of U.S. dollar-denominated bonds from sovereign and sub-sovereign issuers in emerging markets.  The index provides a broad measure of emerging market bonds while adhering to stringent liquidity criteria.  The index could serve as a basis for tradable products such as futures, total return swaps (TRS) and exchange-traded funds (ETFs).

Debt issued by sovereign and sub-sovereign issuers with a notional amount of at least USD 1 billion and at least one year to maturity from rebalance date are eligible for entry.  Similarly to the benchmark, the index uses the IHS Markit Global Economic Development Classification Methodology to catalogue a country as emerging or developed.  Except for the Gulf Cooperation Council (GCC) members, regions with a Global National Income (GNI) per capita higher than two times the World Bank GNI high income cut-off during the past five years are excluded.  The index uses a novel country capping methodology, reviewed annually in December.  

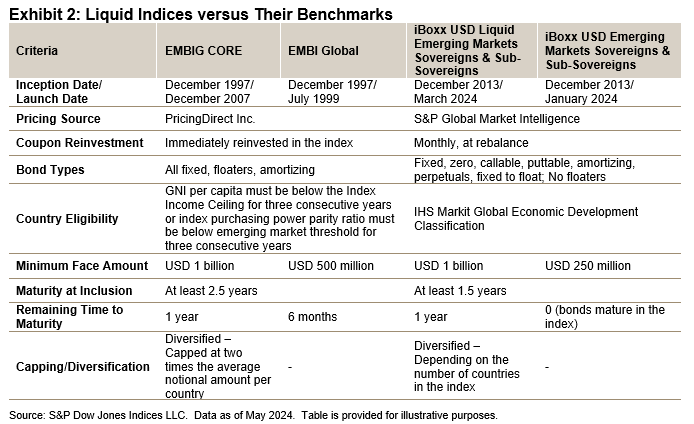
The capping is based on two variables: 1) the average country weight, defined as one divided by the number of countries in the index; and 2) weight-based capping defined as three times the average country weight, rounded to the nearest 2.5%. Exhibit 1 illustrates how the capping methodology was applied starting Dec. 31, 2023.  The 7.5% capping became effective in January 2024.

The iBoxx USD Liquid Emerging Markets Sovereigns & Sub-Sovereigns: A New Tool for the Emerging Market Bond Ecosystem: Exhibit 1

The index uses bid-side pricing; however, new securities are included at the ask price.  Coupons are reinvested at the end of the month and the index is rebalanced monthly, on the last business day.  The index excludes floating rate bonds.

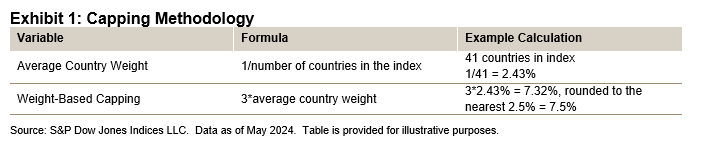
The oldest benchmark in the market is J. P. Morgan’s Emerging Markets Bond Index Global Core (EMBIG CORE), which is based on J. P. Morgan’s EMBI Global.  The EMBIG CORE tracks liquid, U.S. dollar-denominated, emerging market fixed and floating rate bonds issued by sovereign and quasi-sovereign entities.  The main differences between the iBoxx USD Liquid Emerging Markets Sovereigns and Sub-Sovereigns and the J. P. Morgan EMBI Global are outlined in Exhibit 2.

The iBoxx USD Liquid Emerging Markets Sovereigns & Sub-Sovereigns: A New Tool for the Emerging Market Bond Ecosystem: Exhibit 2

pdf-icon PD F Download Full Article

FAQ: S&P Dow Jones Indices’ June 2024 Quarterly Rebalance of the Technology Select Sector Index

Company Background

S&P Dow Jones Indices (S&P DJI) is home to iconic financial market indicators, such as the S&P 500® and the Dow Jones Industrial Average® and is the largest global resource for essential index-based market concepts, data, and research.

Today, S&P DJI offers an extensive range of indices and index-based solutions to address varying performance objectives. These include the Select Sector Index Series, which is designed to track major economic sectors, such as Information Technology.

1. What is the Technology Select Sector Index? All components of the S&P 500 are assigned to 1 of the 11 Select Sector Indices, which track major economic segments and are highly liquid benchmarks. Stock classifications are based on the Global Industry Classification Standard (GICS®).

The Technology Select Sector Index is part of the Select Sector Index Series and is governed by the S&P U.S. Indices methodology. Per the methodology document, capping is applied to ensure diversification among companies within each index.

Further, S&P Dow Jones Indices initiated calculation of the Select Sector Indices as of Jan. 28, 2011. The Technology Select Sector Index was launched on Dec. 16, 1998. Prior to that date, the indices were calculated by affiliates of the New York Stock Exchange. Total return versions of the Select Sector Indices were launched on Jan. 28, 2011, with a launch value of 1000.

2. How is the Technology Select Sector Index constructed? As mentioned, the Technology Select Sector Index is part of the Select Sector Index Series and is governed by the S&P U.S. Indices methodology. The Technology Select Sector Index comprises all S&P 500 companies that are classified as Information Technology companies under the GICS framework. The assignment of companies under the GICS framework is outlined in the GICS methodology.

The Select Sector Indices are rebalanced quarterly after the close of the third Friday in March, June, September and December. The Select Sector Indices also employ a secondary rebalancing check on the second-to-last business day of March, June, September and December.

Each index within the Select Sector Index Series is capped market-capitalization weighted.

3. Why does the Select Sector Index Series use a capping mechanism?  Capping is applied to ensure diversification among companies within each index. The capping thresholds defined in the Select Sector weighting section of the S&P U.S. Indices methodology document are intended to reflect certain diversification requirements imposed on regulated investment companies under the United States Internal Revenue Code (the “Code”) and the Investment Company Act of 1940 (the “40 Act”).

For more information on the capping thresholds, please refer to the Regulatory Capping Requirements section of S&P Dow Jones Indices’ Equity Indices Policies & Practices Methodology.

pdf-icon PD F Download Full Article

Spotlight on Asian Credit – An Index Perspective

Contributor Image
Kangwei Yang

Director, Fixed Income Indices

S&P Dow Jones Indices

Contributor Image
Srichandra Masabathula

Director, Fixed Income Tradable Products

S&P Dow Jones Indices

Current Landscape

The understanding of Asian credit has experienced some changes over recent years.  The traditional view of Asian credit has largely been U.S. dollar bonds from Asian issuers outside Japan.  This was also how most investment and risk teams were set up in the region.  Teams that were set up to manage the broader Asia-Pacific (APAC) markets—which include Australia, New Zealand and Japan—only existed within a few organizations.

Today, there is much more acceptance of an APAC viewpoint.  This change was driven by a couple of factors—namely the unfolding of the real estate crisis in China, which had a profound impact on the Asian high yield market, as well as the need for greater geographical diversification within the Asian credit space.  For context, as of Feb. 29, 2024, the weight of USD bonds with exposure to China was around 40.3% in the Asia ex-Japan market, as represented by the iBoxx USD Asia ex-Japan.  The same exposure drops to 26.7% in the context of APAC, as represented by the iBoxx USD Asia-Pacific.

Over the course of 2022 and 2023, the total notional of Chinese USD bonds in the iBoxx USD Asia-Pacific dropped more than 30%, largely due to defaults from Chinese real estate issuers and debt refinancing moving onshore or to the dim sum bond market.  Meanwhile, APAC USD bonds issued outside of China painted a different picture.

Over the same period, non-China APAC USD bonds increased by 8.8%.  Despite the uptick, overall growth in the segment slowed to more than one-half of the level seen in 2020 and 2021.  On top of the tightening of monetary policy in the U.S. driven by higher inflation in 2022—making issuing new bonds much more expensive—uncertain economic conditions also resulted in companies being less willing to take risks, and thus reduced borrowing for business expansions.

As seen in Exhibit 1, the notional of Asian credit bonds (as measured by the iBoxx USD Asia ex-Japan) grew substantially over the past 10 years, despite the recent slowdown.  From Dec. 31, 2013, to Feb. 29, 2024, it saw an (absolute) increase of 262.2%, slightly larger than the 245.8% increase in the broader APAC markets, as measured by the iBoxx USD Asia-Pacific.

Spotlight on Asian Credit – An Index Perspective: Exhibit 1

pdf-icon PD F Download Full Article

The Evolving Growth Story of China's Economy: The S&P China Consumption Index

Contributor Image
Darius Nass

Associate Director, Global Equity Indices

S&P Dow Jones Indices

China is undergoing a significant economic transformation, shifting its focus from traditional manufacturing and investment to a consumer and service-oriented market.  This pivotal change, catering to the demands and preferences of an expanding middle class, is reshaping the investment landscape and may offer new opportunities and challenges for investors.  While recent market fluctuations are noteworthy, they do not diminish the long-term trajectory of this economic evolution.  This paper examines how the S&P China Consumption Index is strategically positioned to reflect these ongoing developments.

Executive Summary

  • The expansion of China's middle class (expected to grow by 80 million by 2030) and service sectors (now accounting for 50% of GDP) underscore how China's economic shift signals the need for a more focused index-based investment strategy.
  • Government policies fostering innovation in business models have been instrumental in the transformation in consumer behavior.
  • The S&P China Consumption Index reflects these trends, and the index historically outperformed broader Chinese indices by focusing on the sectors and industries most affected by these changes.
  • Outperformance was driven by sector allocation effects, as the index strategically emphasizes Consumer Discretionary, Communication Services and Consumer Staples, while excluding traditional sectors like Energy and Materials.

China's Economic Growth Story

The economic climate in 2023 and the beginning of 2024 was characterized by increasing interest rates and lingering inflation, and major economies worldwide have been navigating varied challenges and recovery paths.  Within this context, China's narrative still stands out.  Despite facing its own set of challenges, China's economy, once driven by manufacturing and investment, is transitioning toward a more consumption-centric and service-driven model. This shift is evident in the IMF’s forecast growth rate for China of 5.4% in 2023, poised to surpass the more modest growth expectations for the U.S. (2.1%) and Europe (0.7%), where recession risks loom.

China is witnessing a significant expansion of its middle class, which is projected to grow by 80 million by 2030, establishing an affluent consumer segment. Further fueling this evolution, over one-half of China's GDP is now attributed to the services sector, signifying a substantial deepening of the consumer market.

The evolution in Chinese consumer behavior, alongside the robust economic growth trajectory of the world’s most populated country, offers a unique opportunity for investors.  Recognizing the need for a nuanced, adaptive approach to take full advantage of this ongoing economic growth, the introduction of the S&P China Consumption Index comes at a crucial point in time.  The index focuses on subtle shifts in the Chinese consumer market, providing a sophisticated tool to measure China's dynamic economic landscape.

pdf-icon PD F Download Full Article

Introducing the S&P Sustainable Development Goals Indices

Contributor Image
María Sánchez

Director, Sustainability Index Product Management, U.S. Equity Indices

S&P Dow Jones Indices

Contributor Image
Stephanie Rowton

Director, Head of Sustainability Indices EMEA

S&P Dow Jones Indices

Executive Summary

On Jan. 9, 2024, S&P Dow Jones Indices (S&P DJI) announced the expansion of its suite of sustainability-oriented indices with the launch of the S&P 500® SDG Index and the S&P Global LargeMidCap SDG Index.  The indices are designed to offer market participants broad-based equity performance measurements and diverse exposures to companies that are collectively more aligned with the United Nations’ 17 Sustainable Development Goals (SDGs).

This paper:

  • Explains the underlying data used for the index construction.
  • Explains the construction of the S&P SDG Indices.
  • Summarizes the historical results of the S&P SDG Indices relative to their respective underlying indices. This includes:
    • Improved index-level exposure to positively aligned SDG revenue.
    • Reduced index-level exposure to negatively aligned SDG revenue.
    • Increased index-level exposure to companies that have operational performance aligned to the SDGs (measured by the SDG operation score).
    • Reduced index-level greenhouse gas (GHG, expressed in CO2 equivalents) emissions intensity.

Introduction

"The 17 Sustainable Development Goals (SDGs), which are an urgent call for action by all countries—developed and developing—in a global partnership. They recognize that ending poverty and other deprivations must go hand-in-hand with strategies that improve health and education, reduce inequality, and spur economic growth—all while tackling climate change and working to preserve our oceans and forests.” The 17 goals are a result of more than a decade of work, with each goal encompassing a clearly stated objective and multiple measurable targets. While the SDGs were initially created as a shared roadmap for countries, they can also be used as a framework for investors. This is because the data allows for the identification and measurement of specific impact(s) that a company’s activities may have on both society and the environment—regardless of the financial materiality.

Resultingly, S&P DJI has designed a transparent index methodology which looks to provide investors with the opportunity to align their investments to the UN’s SDGs and deploy capital toward specific societal and sustainability-focused objectives.

pdf-icon PD F Download Full Article

Processing ...