IN THIS LIST

TalkingPoints: U.S. Equities and Sectors in Election Years

The iBoxx USD Liquid Emerging Markets Sovereigns & Sub-Sovereigns: A New Tool for the Emerging Market Bond Ecosystem

FAQ: S&P Dow Jones Indices’ June 2024 Quarterly Rebalance of the Technology Select Sector Index

Spotlight on Asian Credit – An Index Perspective

Introducing the S&P Sustainable Development Goals Indices

TalkingPoints: U.S. Equities and Sectors in Election Years

Contributor Image
Hamish Preston

Head of U.S. Equities

S&P Dow Jones Indices

1. Why is the U.S. market relevant to investors worldwide?

The U.S. equity market is the largest in the world, with U.S.-domiciled companies representing 60% of the index market capitalization of S&P Dow Jones Indices’ (S&P DJI’s) global equity barometer—the S&P Global BMI—at the end of March 2024. The U.S. also accounts for most of the index market capitalization in 10 of the 11 S&P Global BMI GICS sectors.

Hence, market participants that do not have a U.S. view risk overlooking a sizeable portion of the global equity opportunity set. Not only might this make it more difficult to explain the impact of narratives on global equity returns, but the distinct makeup of the U.S. equity market means that overlooking U.S. equities may impact investors’ abilities to gain strategic or tactical exposures.

2. What role can indices play in measuring equity markets?

Since Charles Dow and Edward Jones began publishing the first ever index—the Dow Jones Railroad Average—towards the end of the 19th century, indices have allowed investors to monitor the impact of trends on different market segments and to benchmark the performance of active managers.

While the first indices were equity market measures, transparent, rules-based indices have since been created for a variety of asset classes. Nowadays, indices also measure the performance of more complex strategies previously thought to be solely within the realm of active management.

Accompanying—and to a large extent, driving—the proliferation of index information, indices have come to serve as the basis for investment products, globally. The substantial adoption of index-based investment products has been driven by the increased awareness of the substantial body of evidence that shows that most active managers underperformed on an absolute and risk-adjusted basis most of the time. For example, more than 90% of U.S. Large-Cap funds based in the U.S. underperformed the S&P 500® over a 20-year period ending on Dec. 31, 2023.European Equity funds focused on large-cap U.S. equities posted similar underperformance rates: more than 90% of such active funds underperformed the S&P 500 over the 10-year period ending on Dec. 31, 2023.

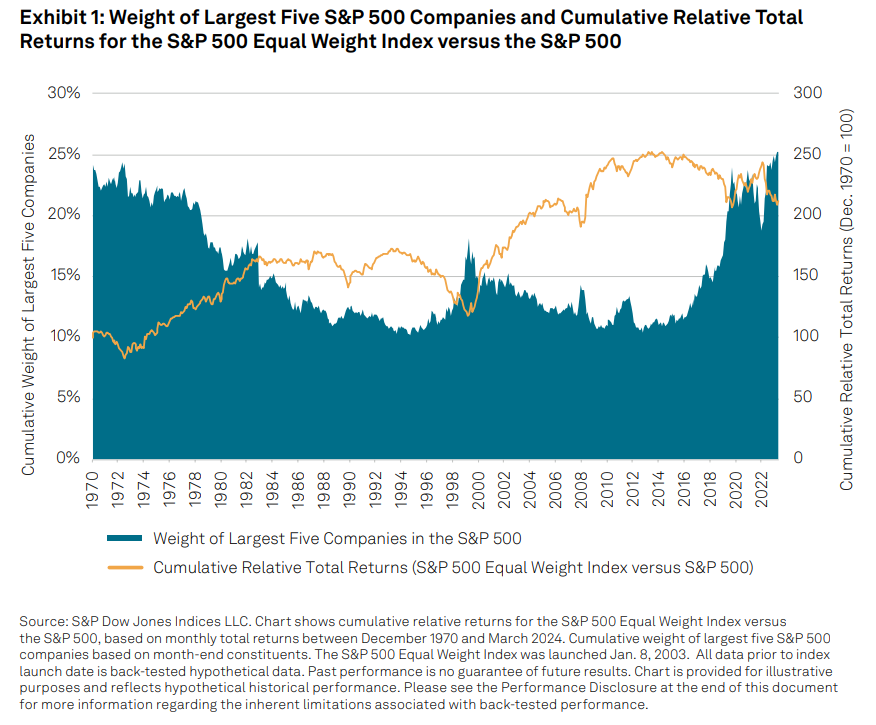
3. The S&P 500 Equal Weight Index has been a popular strategy recently. What are the drivers behind this?

A notable trend in U.S. equities over the past year has been the outperformance of some of the largest companies as investors expressed their views on the potential impact of artificial intelligence on companies’ growth prospects. Against this backdrop, the representation of mega-cap companies in the S&P 500 reached multi-decade highs: the cumulative weight of the largest five companies in the S&P 500 was 25.3% at the end of March 2024—a level that has not been seen since December 1970. 

Although elevated stock-level concentration demonstrates that the S&P 500 continues to meet its stated objective of measuring the performance of large-cap U.S. equities, many investors have turned to an equal weight approach to reduce exposure to the largest names and to express views on mean reversion in equity market concentrations.

The relevance of the S&P 500 Equal Weight Index in these considerations comes from its smaller size exposure: assigning egalitarian allocations to the S&P 500’s component companies on a quarterly basis means that the equal weight index has less weight in the largest names. This methodology helped to explain most of the S&P 500 Equal Weight Index’s relative performance versus the S&P 500 over the past year, and it provides a tangible link between changes in market concentration and the equal weight index’s relative returns.

Typically, when the largest companies (to which equal weight has less sensitivity) outperformed, concentration rose, and equal weight underperformed its cap-weighted benchmark. Conversely, outperformance among smaller companies (to which equal weight has greater exposure) led to reduced concentration and greater likelihood of equal weight outperformance.

Exhibit 1: Weight of Largest Five S&P 500 Companies and Cumulative Relative Total Returns for the S&P 500 Equal Weight Index Versus the S&P 500

pdf-icon PD F Download Full Article

The iBoxx USD Liquid Emerging Markets Sovereigns & Sub-Sovereigns: A New Tool for the Emerging Market Bond Ecosystem

Contributor Image
Catalina Zota

Associate Director, Fixed Income Product Management

S&P Dow Jones Indices

Contributor Image
Nicholas Godec

Senior Director, Head of Fixed Income Tradables & Private Markets

S&P Dow Jones Indices

Executive Summary

The iBoxx USD Liquid Emerging Markets Sovereigns & Sub-Sovereigns index tracks the performance of U.S. dollar-denominated bonds from sovereign and sub-sovereign issuers in emerging markets.  The index provides a broad measure of emerging market bonds while adhering to stringent liquidity criteria.  The index could serve as a basis for tradable products such as futures, total return swaps (TRS) and exchange-traded funds (ETFs).

Debt issued by sovereign and sub-sovereign issuers with a notional amount of at least USD 1 billion and at least one year to maturity from rebalance date are eligible for entry.  Similarly to the benchmark, the index uses the IHS Markit Global Economic Development Classification Methodology to catalogue a country as emerging or developed.  Except for the Gulf Cooperation Council (GCC) members, regions with a Global National Income (GNI) per capita higher than two times the World Bank GNI high income cut-off during the past five years are excluded.  The index uses a novel country capping methodology, reviewed annually in December.  

The capping is based on two variables: 1) the average country weight, defined as one divided by the number of countries in the index; and 2) weight-based capping defined as three times the average country weight, rounded to the nearest 2.5%. Exhibit 1 illustrates how the capping methodology was applied starting Dec. 31, 2023.  The 7.5% capping became effective in January 2024.

The iBoxx USD Liquid Emerging Markets Sovereigns & Sub-Sovereigns: A New Tool for the Emerging Market Bond Ecosystem: Exhibit 1

The index uses bid-side pricing; however, new securities are included at the ask price.  Coupons are reinvested at the end of the month and the index is rebalanced monthly, on the last business day.  The index excludes floating rate bonds.

The oldest benchmark in the market is J. P. Morgan’s Emerging Markets Bond Index Global Core (EMBIG CORE), which is based on J. P. Morgan’s EMBI Global.  The EMBIG CORE tracks liquid, U.S. dollar-denominated, emerging market fixed and floating rate bonds issued by sovereign and quasi-sovereign entities.  The main differences between the iBoxx USD Liquid Emerging Markets Sovereigns and Sub-Sovereigns and the J. P. Morgan EMBI Global are outlined in Exhibit 2.

The iBoxx USD Liquid Emerging Markets Sovereigns & Sub-Sovereigns: A New Tool for the Emerging Market Bond Ecosystem: Exhibit 2

pdf-icon PD F Download Full Article

FAQ: S&P Dow Jones Indices’ June 2024 Quarterly Rebalance of the Technology Select Sector Index

Company Background

S&P Dow Jones Indices (S&P DJI) is home to iconic financial market indicators, such as the S&P 500® and the Dow Jones Industrial Average® and is the largest global resource for essential index-based market concepts, data, and research.

Today, S&P DJI offers an extensive range of indices and index-based solutions to address varying performance objectives. These include the Select Sector Index Series, which is designed to track major economic sectors, such as Information Technology.

1. What is the Technology Select Sector Index? All components of the S&P 500 are assigned to 1 of the 11 Select Sector Indices, which track major economic segments and are highly liquid benchmarks. Stock classifications are based on the Global Industry Classification Standard (GICS®).

The Technology Select Sector Index is part of the Select Sector Index Series and is governed by the S&P U.S. Indices methodology. Per the methodology document, capping is applied to ensure diversification among companies within each index.

Further, S&P Dow Jones Indices initiated calculation of the Select Sector Indices as of Jan. 28, 2011. The Technology Select Sector Index was launched on Dec. 16, 1998. Prior to that date, the indices were calculated by affiliates of the New York Stock Exchange. Total return versions of the Select Sector Indices were launched on Jan. 28, 2011, with a launch value of 1000.

2. How is the Technology Select Sector Index constructed? As mentioned, the Technology Select Sector Index is part of the Select Sector Index Series and is governed by the S&P U.S. Indices methodology. The Technology Select Sector Index comprises all S&P 500 companies that are classified as Information Technology companies under the GICS framework. The assignment of companies under the GICS framework is outlined in the GICS methodology.

The Select Sector Indices are rebalanced quarterly after the close of the third Friday in March, June, September and December. The Select Sector Indices also employ a secondary rebalancing check on the second-to-last business day of March, June, September and December.

Each index within the Select Sector Index Series is capped market-capitalization weighted.

3. Why does the Select Sector Index Series use a capping mechanism?  Capping is applied to ensure diversification among companies within each index. The capping thresholds defined in the Select Sector weighting section of the S&P U.S. Indices methodology document are intended to reflect certain diversification requirements imposed on regulated investment companies under the United States Internal Revenue Code (the “Code”) and the Investment Company Act of 1940 (the “40 Act”).

For more information on the capping thresholds, please refer to the Regulatory Capping Requirements section of S&P Dow Jones Indices’ Equity Indices Policies & Practices Methodology.

pdf-icon PD F Download Full Article

Spotlight on Asian Credit – An Index Perspective

Contributor Image
Kangwei Yang

Director, Fixed Income Indices

S&P Dow Jones Indices

Contributor Image
Srichandra Masabathula

Director, Fixed Income Tradable Products

S&P Dow Jones Indices

Current Landscape

The understanding of Asian credit has experienced some changes over recent years.  The traditional view of Asian credit has largely been U.S. dollar bonds from Asian issuers outside Japan.  This was also how most investment and risk teams were set up in the region.  Teams that were set up to manage the broader Asia-Pacific (APAC) markets—which include Australia, New Zealand and Japan—only existed within a few organizations.

Today, there is much more acceptance of an APAC viewpoint.  This change was driven by a couple of factors—namely the unfolding of the real estate crisis in China, which had a profound impact on the Asian high yield market, as well as the need for greater geographical diversification within the Asian credit space.  For context, as of Feb. 29, 2024, the weight of USD bonds with exposure to China was around 40.3% in the Asia ex-Japan market, as represented by the iBoxx USD Asia ex-Japan.  The same exposure drops to 26.7% in the context of APAC, as represented by the iBoxx USD Asia-Pacific.

Over the course of 2022 and 2023, the total notional of Chinese USD bonds in the iBoxx USD Asia-Pacific dropped more than 30%, largely due to defaults from Chinese real estate issuers and debt refinancing moving onshore or to the dim sum bond market.  Meanwhile, APAC USD bonds issued outside of China painted a different picture.

Over the same period, non-China APAC USD bonds increased by 8.8%.  Despite the uptick, overall growth in the segment slowed to more than one-half of the level seen in 2020 and 2021.  On top of the tightening of monetary policy in the U.S. driven by higher inflation in 2022—making issuing new bonds much more expensive—uncertain economic conditions also resulted in companies being less willing to take risks, and thus reduced borrowing for business expansions.

As seen in Exhibit 1, the notional of Asian credit bonds (as measured by the iBoxx USD Asia ex-Japan) grew substantially over the past 10 years, despite the recent slowdown.  From Dec. 31, 2013, to Feb. 29, 2024, it saw an (absolute) increase of 262.2%, slightly larger than the 245.8% increase in the broader APAC markets, as measured by the iBoxx USD Asia-Pacific.

Spotlight on Asian Credit – An Index Perspective: Exhibit 1

pdf-icon PD F Download Full Article

Introducing the S&P Sustainable Development Goals Indices

Contributor Image
María Sánchez

Director, Sustainability Index Product Management, U.S. Equity Indices

S&P Dow Jones Indices

Contributor Image
Stephanie Rowton

Director, Head of Sustainability Indices EMEA

S&P Dow Jones Indices

Executive Summary

On Jan. 9, 2024, S&P Dow Jones Indices (S&P DJI) announced the expansion of its suite of sustainability-oriented indices with the launch of the S&P 500® SDG Index and the S&P Global LargeMidCap SDG Index.  The indices are designed to offer market participants broad-based equity performance measurements and diverse exposures to companies that are collectively more aligned with the United Nations’ 17 Sustainable Development Goals (SDGs).

This paper:

  • Explains the underlying data used for the index construction.
  • Explains the construction of the S&P SDG Indices.
  • Summarizes the historical results of the S&P SDG Indices relative to their respective underlying indices. This includes:
    • Improved index-level exposure to positively aligned SDG revenue.
    • Reduced index-level exposure to negatively aligned SDG revenue.
    • Increased index-level exposure to companies that have operational performance aligned to the SDGs (measured by the SDG operation score).
    • Reduced index-level greenhouse gas (GHG, expressed in CO2 equivalents) emissions intensity.

Introduction

"The 17 Sustainable Development Goals (SDGs), which are an urgent call for action by all countries—developed and developing—in a global partnership. They recognize that ending poverty and other deprivations must go hand-in-hand with strategies that improve health and education, reduce inequality, and spur economic growth—all while tackling climate change and working to preserve our oceans and forests.” The 17 goals are a result of more than a decade of work, with each goal encompassing a clearly stated objective and multiple measurable targets. While the SDGs were initially created as a shared roadmap for countries, they can also be used as a framework for investors. This is because the data allows for the identification and measurement of specific impact(s) that a company’s activities may have on both society and the environment—regardless of the financial materiality.

Resultingly, S&P DJI has designed a transparent index methodology which looks to provide investors with the opportunity to align their investments to the UN’s SDGs and deploy capital toward specific societal and sustainability-focused objectives.

pdf-icon PD F Download Full Article

Processing ...