IN THIS LIST

TalkingPoints: The iBoxx ChinaBond Asian High Yield Index

FAQ: S&P 500 Dividend Points Index

Spotlight on the S&P/BMV ESG Indices

S&P Kensho Artificial Intelligence Enablers & Adopters Index Selection Process Overview

TalkingPoints: S&P 500 Sector-Neutral Dividend Aristocrats Index

TalkingPoints: The iBoxx ChinaBond Asian High Yield Index

Contributor Image
Kangwei Yang

Director, Fixed Income Indices

S&P Dow Jones Indices

The iBoxx ChinaBond Asian High Yield is designed to reflect the performance of high yield bonds from Asian issuers, denominated in USD, CNY and SGD. This index is a joint initiative between S&P Dow Jones Indices (S&P DJI) and ChinaBond Pricing Center Co., Ltd. (CBPC). The index seeks to combine the bond valuation data and domestic market expertise of CBPC with S&P DJI’s award-winning global fixed income index expertise that provides investors with accurate and objective indices to assess the performance of the respective underlying markets and investments.

1. Why was the iBoxx ChinaBond Asian High Yield launched?

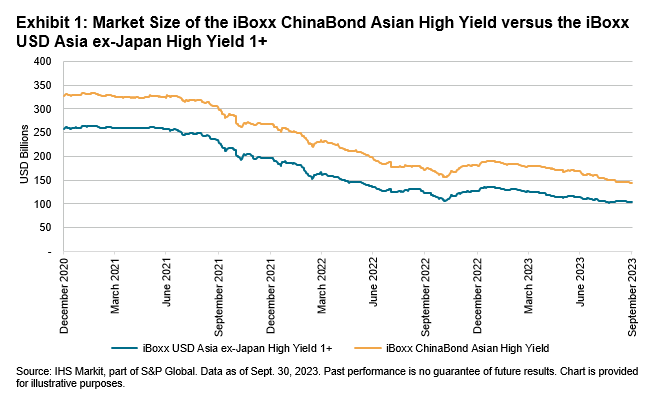
S&P DJI: Historically, the Asian high yield market has been mostly dedicated to the U.S. dollar (USD) space, where Real Estate bonds from Chinese issuers made up close to half of the market prior to the beginning of China’s Real Estate shift in 2021. Since then, the aggregate market size of Asian USD high yield bonds has declined significantly, as represented by iBoxx USD Asia ex-Japan High Yield 1+ (see Exhibit 1). The declining market size presents challenges for Asian high yield fund managers, including the ability to continue to allocate and find liquidity in the remaining Asian high yield bonds in the index.

At the same time, Asian local currencies have continued to gather interest from investors as a diversifier from traditional hard currency exposures. Asian local currency bond markets, as a whole, have also grown in size and depth over the past few years. These factors drove us to evaluate the accessible local currency bond markets with significant high yield exposure, and as a result, we partnered with CBPC to develop the iBoxx ChinaBond Asian High Yield, which tracks Asian-issued USD, CNY and SGD bonds. As seen in Exhibit 1, with the inclusion of Asian local currency bonds, the iBoxx ChinaBond Asian High Yield consistently provided a larger market size (capacity) compared to the iBoxx USD Asia ex-Japan 1+ from Dec. 31, 2020, to Sept. 30, 2023.

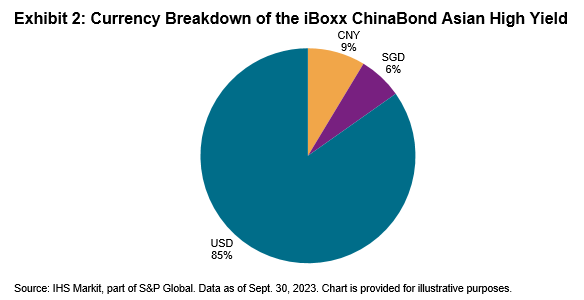
The goal of this index is to provide a measure for investable high yield bonds in the Asian market beyond USD-denominated bonds, as well as to give a broader perspective of the Asian high yield space as local bond markets continue to develop in the years to come. Exhibit 2 shows the breakdown of bonds in the index by currency, as of Sept. 30, 2023.

TalkingPoints: The iBoxx ChinaBond Asian High Yield Index: Exhibit 1

TalkingPoints: The iBoxx ChinaBond Asian High Yield Index: Exhibit 2

2. What are some of the considerations in the methodology of the iBoxx ChinaBond Asian High Yield?

S&P DJI: When we designed the index, the intention was to produce a view of the Asian high yield market that investors were familiar with (i.e., USD bonds), yet, at the same time, expand that view to introduce elements of local currency exposure to broaden the index universe.

As a result, from an index methodology perspective, we have implemented an overall issuer cap of 2%. Additionally, non-USD issuers are subject to a cap of 0.5% of the overall index. This approach seeks to address three concerns. First, it aims to minimize accessibility issues to local currency bonds for investors who might be concerned about liquidity. Second, for index funds, this rule allows investors to gradually become accustomed to local currency bond markets without a need to purchase large amounts of local currency bond exposure instantaneously. Third, this serves to provide greater diversification across issuers in the index.

Determining which local markets would be eligible for inclusion into the index was another consideration. From that perspective, we looked at the general liquidity, accessibility and size of the local markets, especially those with larger high yield issuances. As a result, we have had CNY and SGD local markets represented in the index from the onset. In the long term, the aim is to periodically review the eligibility of other Asian local currency markets as regional bond markets continue to grow.

pdf-icon PD F Download Full Article

FAQ: S&P 500 Dividend Points Index

  1. What are S&P Dow Jones Indices’ Dividend Point Indices?  These indices are designed to track the total dividend payments from the constituents of an underlying index. The level of the index is based on a running total of the dividends from the underlying index’s constituents. Some indices reset to zero on a periodic basis, generally quarterly or annually. Thus, the index seeks to measure the total dividends paid in the underlying index since the previous rebalancing date, or the base date for indices that do not reset on a periodic basis. For quarterly indices, the index resets to zero after the close on the third Friday of the last month of the quarter in order to coincide with futures and options expiration. For annual indices, the index resets to zero after the close on the third Friday of December in order to coincide with futures and options expiration.

    The formula for calculating the dividend point index on any date, t, for a given underlying index, x, is:

    Equation 1: FAQ: S&P 500 Dividend Points Index

    The index dividend (ID) of the underlying index is calculated on any given day as the total dividend value for all constituents of the index divided by the index divisor. The total dividend value is calculated as the sum of dividends per share multiplied by index shares outstanding for all constituents of the index which have a dividend going ex on the date in question.

    Please refer to the S&P Dow Jones Indices’ Index Mathematics Methodology for more detail.

  1. What are “dividend points?”  Index points refer to the level of an index. For example, if the S&P 500 is trading at 2,100, it is said to have a level of 2,100 points. Dividend points specifically refer to the level of index points that are directly attributable to the dividends of index constituents.
  2. What’s the difference between dividend points indices and other types of indices, like price return and total return indices?  Price return indices represent changes in the market capitalization of index constituents. They do not account for dividends. The headline S&P 500, which is frequently referred to in financial media, is a price return index. There is a related index called the S&P 500 Total Return, which calculates what the performance would be if dividends paid by index constituents on the ex-dividend date of each index share were reinvested. Total return indices, therefore, represent changes in market capitalization plus reinvested dividends. Finally, dividend points indices track dividend payments in isolation, reflecting the periodic cumulative dividends of all index shares. They do not include any changes in market capitalization.

    One can think of the different types of indices as representing different investment strategies. Some investors elect to reinvest dividends in the stocks they hold, and this strategy could be benchmarked with the S&P 500 Total Return. On the other hand, some investors hold stocks but do not reinvest dividends—electing instead to take dividends in cash as a source of income. This strategy could be benchmarked with a combination of the S&P 500 Price Return and a S&P 500 Dividend Points Index.

pdf-icon PD F Download Full Article

Spotlight on the S&P/BMV ESG Indices

Contributor Image
Aran Spivey

Senior Analyst, Sustainability Indices

S&P Dow Jones Indices

Since 2015, S&P Dow Jones Indices (S&P DJI) has had a proud partnership with La Bolsa Mexicana de Valores (BMV Group).  Together, we develop, license, distribute and manage co-branded indices, including equity, debt and multi-asset indices, with the aim of bringing a more extensive line-up of index choices to the Mexican and global financial markets.

One area of increasing interest in the indexing space is sustainability indices, which are built to provide benchmarks focused on companies demonstrating strong environmental, social and governance (ESG) credentials compared with their peers.  In recent years, S&P DJI has built up its catalogue of sustainability indices to over 200, offering investors a suite of solutions ranging from simple exclusionary screening approaches all the way to net zero climate-focused strategies.

In partnership with BMV Group, we have two main equity sustainability indices focusing on Mexican equities with a sustainability lens, the S&P/BMV Total Mexico ESG Index and S&P/BMV IPC ESG Tilted Index (see Exhibit 1).  We also provide sustainable versions of certain factor and thematic indices.  

Principal S&P/BMV Equity Sustainability Indices: Exhibit 1

A key input into each of these indices is the use of S&P DJI ESG Scores. S&P DJI ESG Scores robustly measure ESG risk and performance factors for corporations, with a focus on financial materiality.  The fundamental research process is outlined in Exhibit 2.

pdf-icon PD F Download Full Article

S&P Kensho Artificial Intelligence Enablers & Adopters Index Selection Process Overview

Contributor Image
Srineel Jalagani

Senior Director, Thematic Indices

S&P Dow Jones Indices

S&P Dow Jones Indices (S&P DJI) launched the S&P Kensho Artificial Intelligence Enablers & Adopters 50 Point Decrement Index in September 2023.  The index seeks to measure the performance of the underlying index, the S&P Kensho Artificial Intelligence Enablers & Adopters Index, less a fixed amount of 50 bps.

S&P DJI’s process of constructing all S&P Kensho Thematic Indices starts with the definition of an industry model for a theme.  The goal of this step is to define the scope and technologies in focus for the theme.  In the case of the S&P Kensho Artificial Intelligence (AI) theme, S&P DJI uses a two-pronged approach to select the companies most relevant to the widespread applications of AI across sectors and industries.

S&P DJI draws a distinction between two contributing segments to AI sectors and industries:

  1. Companies that are leading the way in building the infrastructure and the applications that enable AI (AI Enablers); and
  2. Companies that are adopting AI within their business segments to improve their efficiency and expand their product offerings (AI Adopters).

S&P DJI addresses this first contributing segment, AI Enablers, with the S&P Kensho Artificial Intelligence Enablers Index.  The index measures the performance of companies developing and enabling the technology, infrastructure and services that are propelling the growth and functionality of AI, specifically the following.

  • Hardware, including graphics processing units (GPUs), central processing units (CPUs), application-specific integrated circuits (ASICs), field-programmable gate arrays (FPGAs), accelerators and other specialized chips, and computing equipment that support high performance AI and machine learning (ML) computations and operations.
  • Software and solution developers of AI algorithms and products, including large language models (LLM), generative AI, deep learning, robotic process automation, human-to-machine communication and other AI methods.
  • Infrastructure services (cloud, edge and hybrid computing) and big data technology, which are integral to enabling data-intensive AI capabilities.
  • Products and services that provide a framework specifically for AI applications, including AI as a service platforms, cloud-based ML development platforms, automated machine learning (AutoML) tools, AI-based analytics and data visualization platforms, and computer vision technology.
  • Data curation and data management providers of big data extract, transform and load (ETL) solutions that support the effective training and functioning of AI models.

The starting universe of the S&P Kensho Artificial Intelligence Enablers Index is all U.S.-listed companies.  The industry description previously described is distilled down to relevant search terms, which are then searched for by Kensho’s natural language processing (NLP) process in the SEC filing(s) of each U.S.-listed company.  Kensho’s NLP process flags a relevant filing based on the use of any of the search terms in the context of a product or a service that the company offers.  The companies with filings that have been deemed relevant by the NLP model are further reviewed by a human index analyst, and after filtering for minimum market capitalization and USD 3 million average daily trading volume (3m ADTV) thresholds, they become a part of the index composition.

pdf-icon PD F Download Full Article

TalkingPoints: S&P 500 Sector-Neutral Dividend Aristocrats Index

Contributor Image
Rupert Watts

Head of Factors and Dividends, Product Management

S&P Dow Jones Indices

Contributor Image
George Valantasis

Associate Director, Factors and Dividends

S&P Dow Jones Indices

While most dividend products tend to have large sector biases versus their underlying benchmark, the S&P 500 Sector-Neutral Dividend Aristocrats Index is designed specifically to match the sector weights of the S&P 500. This index is the latest addition to the S&P Dividend Aristocrats Series, and as such, it requires constituents to have increased or maintained their dividends for at least 15 consecutive years. Additionally, this index only selects companies that exhibit a high annual dividend yield relative to their peers within the same GICS® sector. Hence, it is designed to display an attractive yield versus its underlying benchmark, the S&P 500.

1. How does this index work?

The S&P 500 Sector-Neutral Dividend Aristocrats Index selects the top 20% of companies with the highest indicated annualized dividend (IAD) yield within each GICS sector that have maintained or increased their dividends for at least 15 consecutive years.

If the number of stocks passing the dividend screen is fewer than the sector target, new stocks are added in descending order of IAD yield, starting with those with the longest history of dividend growth, with a minimum dividend growth history of five years.

The index mirrors the sector weights of the S&P 500, but this rule may be relaxed if the number of eligible companies in the sector is below the target. Constituents are weighted by IAD yield within the GICS sectors, subject to a minimum weight of 0.25% and a maximum weight of 5.00%.

2. What are some of the standout features of the S&P 500 Sector-Neutral Dividend Aristocrats Index?

There are three standout features of the S&P 500 Sector-Neutral Dividend Aristocrats Index.

– The index is differentiated through its sector neutrality, as most dividend strategies tend to have large sector weight differences from their underlying benchmark.

– The index has a stringent selection metric by seeking companies that have maintained or increased dividends for at least 15 years. This eligibility requirement tends to bias the index toward selecting companies with successful business models and disciplined financial management.

– The index has historically showed a substantially higher yield relative to the S&P 500 by selecting companies with the highest IAD yield within each sector.

pdf-icon PD F Download Full Article

Processing ...