IN THIS LIST

TalkingPoints: Capturing the Growth of the Chinese Technology Industry

InstitutionalTalks: Why Multi-Factor Index Construction Matters

Regional Relevancy of S&P 500 and Dow Jones Industrial Average Futures in Asia

FAQ: S&P PACT™ Indices (S&P Paris-Aligned & Climate Transition Indices)

The S&P/B3 Ingenius Index: Bringing Global Innovation to the Brazilian Market

TalkingPoints: Capturing the Growth of the Chinese Technology Industry

Contributor Image
John Welling

Director, Global Equity Indices

S&P Dow Jones Indices

The S&P China Tech 50 Index highlights a unique and innovative set of high-tech companies across multiple sectors in the Chinese market.

1. Why was the S&P China Tech 50 Index introduced?

As China continues its transformation toward "new economy" sectors, technology plays an increasingly important role in the nation's economic and equity market composition. The S&P China Tech 50 Index is unique in that it is based on a transparent, well-established industry classification system (GICS®), and spans multiple industries in order to effectively capture the tech segment. Additionally, it prioritizes liquidity and capacity by limiting constituent count to 50 large, liquid companies.

2. How does the index work?

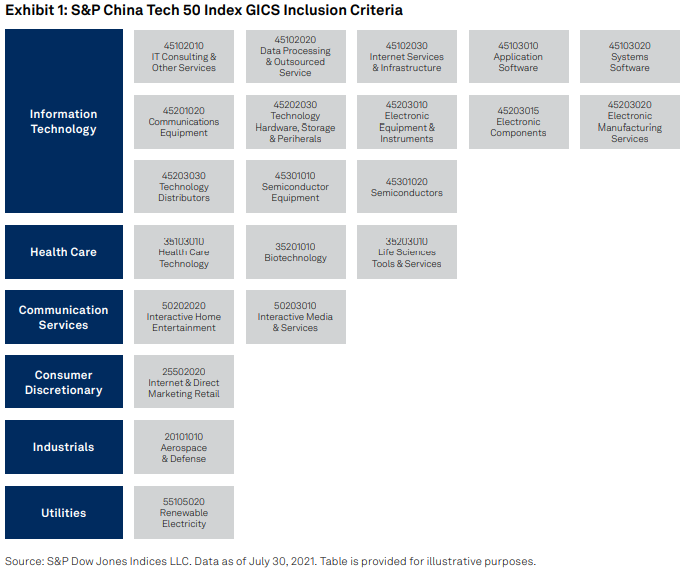
The S&P China Tech 50 Index uses a simple, rules-based process to select 50 of the largest and most liquid Chinese technology companies. The eligible universe includes all Chinese companies meeting minimum float-adjusted  market cap and liquidity thresholds that are accessible via Stock Connect or trade on a foreign exchange. All companies meeting these requirements and classified under the GICS groupings in Exhibit 1 are eligible for inclusion.

TalkingPoints: Capturing the Growth of the Chinese Technology Industry: Exhibit 1

The 50 largest companies (measured by total market cap) are selected and the index is weighted by float-adjusted market cap, subject to a 10% single stock cap. The index is rebalanced semiannually in March and September.

pdf-icon PD F Download Full Article

InstitutionalTalks: Why Multi-Factor Index Construction Matters

InstitutionalTalks is an interview series where industry thinkers share their thoughts and perspectives on a variety of market trends and themes impacting indexing.

Jeb Burns is the Chief Investment Officer of MERS of Michigan, where he directs the USD 15 billion investment program.

Julian Ramirez, CFA, is an Investment Officer and Portfolio Manager at MERS.

S&P DJI: Tell us a bit about your roles at MERS and the individuals you serve.

Jeb: The Municipal Employees’ Retirement System (MERS) of Michigan is an independent, professional retirement services company created to administer the retirement plans for Michigan’s local units of government on a not-for-profit basis. We manage various investment programs for over 900 municipalities throughout the state. We serve more than 100,000 participants, including local firefighters, nurses, and the men and women who plow our roads and keep our communities safe. Total assets for MERS as of June 30, 2021, were valued at USD 15.19 billion, with the defined benefit (DB) portfolio being the largest program, at USD 11.89 billion.

In my role as CIO, I am responsible for the investment management of the plan’s assets. This includes maintaining a successful investment team and culture, recommending and implementing the asset allocation for our investment programs, and regularly reporting to the board and investment committee on investment matters.

pdf-icon PD F Download Full Article

Regional Relevancy of S&P 500 and Dow Jones Industrial Average Futures in Asia

Contributor Image
Izzy Wang

Senior Analyst, Factors and Dividends

S&P Dow Jones Indices

Global markets are increasingly integrated, driven by the diversified global supply chain, deregulation of capital markets, and technological advances. The interconnection of global markets has been the key driver for co-movement of market returns, especially during periods of crisis. This has important consequences in terms of portfolio hedging and risk management.

Meanwhile, with the continued growth in exchange-traded derivatives supported by the need for increased price transparency and liquidity, investors have sought to efficiently integrate listed derivatives into their portfolios.

This paper presents the regional relevancy of S&P 500 and Dow Jones Industrial Average (DJIA) futures for hedging and risk management use by Asian investors.  While the ecosystem around the S&P 500 and DJIA covers multiple areas, including trading of options, ETFs, mutual funds, etc., we are only capturing part of the complexity of Asian trading by limiting the study scope to futures.  We evaluate the usefulness of those instruments through the following metrics.

  • Liquidity: As shown by aggregate U.S. dollar notional total value traded for the futures contracts on the two U.S. benchmarks during Asian trading hours.
  • Co-movements of markets: As measured by correlations between the two U.S. benchmarks and seven major Asian market benchmarks, based on daily returns of the futures prices at Asian end of day.
  • Flexibility: As indicated by contract size and trading hours of the futures on the two U.S. benchmarks versus other major Asian market benchmarks.

The results suggested certain benefits of trading U.S. benchmarks in Asia, providing a new perspective on the use of index derivatives to meet the needs of Asian investors.

pdf-icon PD F Download Full Article

FAQ: S&P PACT™ Indices (S&P Paris-Aligned & Climate Transition Indices)

COMPANY BACKGROUND

  1. Who is S&P Dow Jones Indices?  S&P Dow Jones Indices (S&P DJI) is the largest global resource for essential index-based concepts, data, and research, and is home to iconic financial market indicators, such as the S&P 500® and the Dow Jones Industrial Average®.  More assets are invested in products based on our indices than products based on indices from any other provider in the world.  Since Charles Dow invented the first index in 1884, S&P DJI has been innovating and developing indices across the spectrum of asset classes, helping to define the way investors measure and trade the markets.

  1. Who is S&P Global Trucost?  S&P Global Trucost is a leader in carbon and environmental data and risk analysis and assesses risks relating to climate change, natural resource constraints, and broader environmental, social, and governance (ESG) factors.

    S&P DJI and S&P Global Trucost have a long history of collaboration since launching the first S&P Carbon Efficient Index Series in 2009.  Trucost was acquired by S&P Global in 2016.

S&P Paris-Aligned & Climate Transition Indices

  1. What are the S&P PACT Indices?  The indices are designed to measure the performance of eligible equity securities from an underlying benchmark index, selected and weighted to be collectively compatible with a 1.5ºC global warming climate scenario and to meet several other climate-themed objectives at the index level, as of each rebalance.  PA and CT stand for the S&P Paris-Aligned Climate Indices and S&P Climate Transition Indices, respectively.
  1. Why were the S&P PACT Indices created? The indices aim to incorporate: (a) factors that seek to manage transition risk, physical risk, and climate change opportunities, as proposed by the Financial Stability Board’s Task Force on Climate-related Financial Disclosure (TCFD);(b) the minimum standards for the EU Climate Transition Benchmarks (CTBs) and EU Paris-aligned Benchmarks (PABs), as proposed by the Technical Expert Group on Sustainable Finance (TEG) in its final report of September 2019; and (c) forward-looking scenario analysis.  The final delegated acts were published on Dec. 23, 2020.

pdf-icon PD F Download Full Article

The S&P/B3 Ingenius Index: Bringing Global Innovation to the Brazilian Market

Contributor Image
Silvia Kitchener

Director, Global Equity Indices, Latin America

S&P Dow Jones Indices

INTRODUCTION

Over the past five years, the world witnessed the dramatic rise in the market capitalization of technology-driven companies like Facebook, Amazon, Apple, Netflix, and Google (now Alphabet), collectively known as the FAANG stocks. The growth rates of these stocks over the past five years have been quite remarkable, with the average price change exceeding 250% and outperforming the S&P 500® by 15.5% (see Exhibit 1).

On May 11, 2020, S&P Dow Jones Indices (S&P DJI) and B3 introduced the S&P/B3 Ingenius Index to the Brazilian market. The index seeks to measure the performance of global companies creating many of the innovative products and services that permeate today’s modern world and are transforming almost every aspect of daily life, including the way we communicate, work, entertain, and shop, and nearly everything in between.
By launching the S&P/B3 Ingenius Index, S&P DJI is providing an index that is designed to measure the performance of 15 innovative global companies trading on B3 as Brazilian Depositary Receipts (BDRs), giving local investors access to foreign securities.

The S&P/B3 Ingenius Index: Bringing Global Innovation to the Brazilian Market: Exhibit 1

pdf-icon PD F Download Full Article

Processing ...