IN THIS LIST

Spotlight on the S&P/BMV ESG Indices

S&P Kensho Artificial Intelligence Enablers & Adopters Index Selection Process Overview

TalkingPoints: S&P 500 Sector-Neutral Dividend Aristocrats Index

Exploring S&P PACT™ Indices Weight Attribution

Credit VIX®: A New Tool for Measuring and Managing Credit Risk

Spotlight on the S&P/BMV ESG Indices

Contributor Image
Aran Spivey

Senior Analyst, Sustainability Indices

S&P Dow Jones Indices

Since 2015, S&P Dow Jones Indices (S&P DJI) has had a proud partnership with La Bolsa Mexicana de Valores (BMV Group).  Together, we develop, license, distribute and manage co-branded indices, including equity, debt and multi-asset indices, with the aim of bringing a more extensive line-up of index choices to the Mexican and global financial markets.

One area of increasing interest in the indexing space is sustainability indices, which are built to provide benchmarks focused on companies demonstrating strong environmental, social and governance (ESG) credentials compared with their peers.  In recent years, S&P DJI has built up its catalogue of sustainability indices to over 200, offering investors a suite of solutions ranging from simple exclusionary screening approaches all the way to net zero climate-focused strategies.

In partnership with BMV Group, we have two main equity sustainability indices focusing on Mexican equities with a sustainability lens, the S&P/BMV Total Mexico ESG Index and S&P/BMV IPC ESG Tilted Index (see Exhibit 1).  We also provide sustainable versions of certain factor and thematic indices.  

Principal S&P/BMV Equity Sustainability Indices: Exhibit 1

A key input into each of these indices is the use of S&P DJI ESG Scores. S&P DJI ESG Scores robustly measure ESG risk and performance factors for corporations, with a focus on financial materiality.  The fundamental research process is outlined in Exhibit 2.

pdf-icon PD F Download Full Article

S&P Kensho Artificial Intelligence Enablers & Adopters Index Selection Process Overview

Contributor Image
Srineel Jalagani

Senior Director, Thematic Indices

S&P Dow Jones Indices

S&P Dow Jones Indices (S&P DJI) launched the S&P Kensho Artificial Intelligence Enablers & Adopters 50 Point Decrement Index in September 2023.  The index seeks to measure the performance of the underlying index, the S&P Kensho Artificial Intelligence Enablers & Adopters Index, less a fixed amount of 50 bps.

S&P DJI’s process of constructing all S&P Kensho Thematic Indices starts with the definition of an industry model for a theme.  The goal of this step is to define the scope and technologies in focus for the theme.  In the case of the S&P Kensho Artificial Intelligence (AI) theme, S&P DJI uses a two-pronged approach to select the companies most relevant to the widespread applications of AI across sectors and industries.

S&P DJI draws a distinction between two contributing segments to AI sectors and industries:

  1. Companies that are leading the way in building the infrastructure and the applications that enable AI (AI Enablers); and
  2. Companies that are adopting AI within their business segments to improve their efficiency and expand their product offerings (AI Adopters).

S&P DJI addresses this first contributing segment, AI Enablers, with the S&P Kensho Artificial Intelligence Enablers Index.  The index measures the performance of companies developing and enabling the technology, infrastructure and services that are propelling the growth and functionality of AI, specifically the following.

  • Hardware, including graphics processing units (GPUs), central processing units (CPUs), application-specific integrated circuits (ASICs), field-programmable gate arrays (FPGAs), accelerators and other specialized chips, and computing equipment that support high performance AI and machine learning (ML) computations and operations.
  • Software and solution developers of AI algorithms and products, including large language models (LLM), generative AI, deep learning, robotic process automation, human-to-machine communication and other AI methods.
  • Infrastructure services (cloud, edge and hybrid computing) and big data technology, which are integral to enabling data-intensive AI capabilities.
  • Products and services that provide a framework specifically for AI applications, including AI as a service platforms, cloud-based ML development platforms, automated machine learning (AutoML) tools, AI-based analytics and data visualization platforms, and computer vision technology.
  • Data curation and data management providers of big data extract, transform and load (ETL) solutions that support the effective training and functioning of AI models.

The starting universe of the S&P Kensho Artificial Intelligence Enablers Index is all U.S.-listed companies.  The industry description previously described is distilled down to relevant search terms, which are then searched for by Kensho’s natural language processing (NLP) process in the SEC filing(s) of each U.S.-listed company.  Kensho’s NLP process flags a relevant filing based on the use of any of the search terms in the context of a product or a service that the company offers.  The companies with filings that have been deemed relevant by the NLP model are further reviewed by a human index analyst, and after filtering for minimum market capitalization and USD 3 million average daily trading volume (3m ADTV) thresholds, they become a part of the index composition.

pdf-icon PD F Download Full Article

TalkingPoints: S&P 500 Sector-Neutral Dividend Aristocrats Index

Contributor Image
Rupert Watts

Head of Factors and Dividends, Product Management

S&P Dow Jones Indices

Contributor Image
George Valantasis

Associate Director, Factors and Dividends

S&P Dow Jones Indices

While most dividend products tend to have large sector biases versus their underlying benchmark, the S&P 500 Sector-Neutral Dividend Aristocrats Index is designed specifically to match the sector weights of the S&P 500. This index is the latest addition to the S&P Dividend Aristocrats Series, and as such, it requires constituents to have increased or maintained their dividends for at least 15 consecutive years. Additionally, this index only selects companies that exhibit a high annual dividend yield relative to their peers within the same GICS® sector. Hence, it is designed to display an attractive yield versus its underlying benchmark, the S&P 500.

1. How does this index work?

The S&P 500 Sector-Neutral Dividend Aristocrats Index selects the top 20% of companies with the highest indicated annualized dividend (IAD) yield within each GICS sector that have maintained or increased their dividends for at least 15 consecutive years.

If the number of stocks passing the dividend screen is fewer than the sector target, new stocks are added in descending order of IAD yield, starting with those with the longest history of dividend growth, with a minimum dividend growth history of five years.

The index mirrors the sector weights of the S&P 500, but this rule may be relaxed if the number of eligible companies in the sector is below the target. Constituents are weighted by IAD yield within the GICS sectors, subject to a minimum weight of 0.25% and a maximum weight of 5.00%.

2. What are some of the standout features of the S&P 500 Sector-Neutral Dividend Aristocrats Index?

There are three standout features of the S&P 500 Sector-Neutral Dividend Aristocrats Index.

– The index is differentiated through its sector neutrality, as most dividend strategies tend to have large sector weight differences from their underlying benchmark.

– The index has a stringent selection metric by seeking companies that have maintained or increased dividends for at least 15 years. This eligibility requirement tends to bias the index toward selecting companies with successful business models and disciplined financial management.

– The index has historically showed a substantially higher yield relative to the S&P 500 by selecting companies with the highest IAD yield within each sector.

pdf-icon PD F Download Full Article

Exploring S&P PACT™ Indices Weight Attribution

Contributor Image
Barbara Velado

Senior Analyst, Research & Design ESG Indices

S&P Dow Jones Indices

EXECUTIVE SUMMARY

This paper provides transparency around the S&P PACT Indices (S&P Paris-Aligned & Climate Transition Indices), a sophisticated index solution to align with a 1.5°C trajectory (EU PAB and CTB Aligned).  The indices mitigate a multifaceted range of potential financial risks, while providing exposure to opportunities companies may face from climate change, as laid out by the Task Force on Climate-related Financial Disclosures (TCFD). This paper examines four core universes, including the S&P 500®, S&P Eurozone LargeMidCap, S&P Developed LargeMidCap and S&P Japan LargeMidCap.

  • The S&P PACT Index weights, relative to the benchmark index, are attributable to an exclusion effect (whether a stock is eligible for the index) or reweighting effect (how a stock performs from a climate perspective), as seen in Exhibit 1.
  • The exclusion effect accounts for around 20% of active weights for the S&P Climate Transition (CT) Indices across most universes, while for the more ambitious S&P Paris-Aligned Climate (PA) Indices, exclusions account for 35%-65% of deviations from benchmark weights. The reweighting effect explains the remaining active share.
  • The reweighting effect is driven by climate and index construction factors, which are affected by the strength of constraint, climate datasets distributions and climate factor correlations.

  • A company’s transition pathway, sustainability performance score (as measured by the S&P DJI ESG Score), physical risk exposure, carbon intensity and high climate impact revenues are all key drivers of weighting S&P PACT Index constituents.
  • Climate considerations can be appraised through different lenses, and so we use a range of different datapoints within S&P PACT Indices to capture climate in a holistic way. The high quality climate factors show low correlations between each other, hence explicitly controlling for each of them within the PACT Indices ensures a holistic approach to climate risks and opportunities.
  • Eligible companies can be allocated a higher weight in the S&P PACT Indices by significantly reducing their carbon intensity year-on-year, disclosing more information regarding sustainability policies and metrics, improving performance against sustainability metrics, divesting assets in locations highly exposed to physical risks, and reducing assets’ physical risk sensitivity factors.

Exploring S&P PACT™ Indices Weight Attribution: Exhibit 1

pdf-icon PD F Download Full Article

Credit VIX®: A New Tool for Measuring and Managing Credit Risk

Contributor Image
Srichandra Masabathula

Director, Fixed Income Tradable Products

S&P Dow Jones Indices

Contributor Image
Nicholas Godec

Senior Director, Head of Fixed Income Tradables & Private Markets

S&P Dow Jones Indices

Introduction

The Credit VIX Indices are a new set of benchmarks that seek to measure the expected volatility of credit spreads in North America and Europe over the next one, three and six months.  These indices use a modified methodology based on the Cboe® Volatility Index® (VIX) applied to swaptions based on S&P Dow Jones Indices’ (S&P DJI) iTraxx and CDX indices, European-style credit default swap index options, aggregating prices across different maturities and strike prices.  The result is a number representing expected volatility over different Credit VIX tenors.

Credit VIX®: A New Tool for Measuring and Managing Credit Risk: Exhibit 1

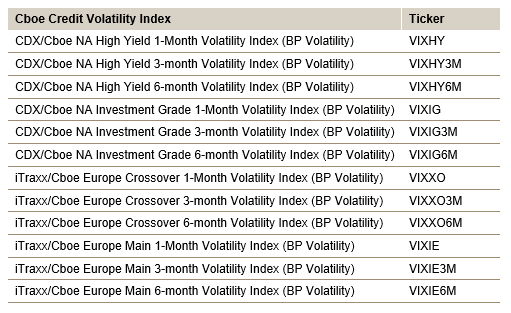
The four most liquid of S&P DJI’s CDS indices underlie the Credit VIX Indices: the CDX® North American High Yield Index (CDX.NA.HY), CDX® North American Investment Grade Index (CDX.NA.IG), iTraxx® Europe Main Index (iTraxx Europe) and the iTraxx® Europe Crossover Index (iTraxx Crossover).  The CDX.NA.IG/CDX.NA.HY and iTraxx Europe/iTraxx Crossover indices, each seek to track baskets of CDS in the North American and European investment grade and high yield markets, respectively.  These indices are highly liquid, with large trading volumes and tight bid-offer spreads. They are also transparent, widely followed and provide broad coverage of key market segments, while focusing on pure credit risk, as opposed to corporate bonds, which include an interest rate component.  This makes these indices a good starting point for the Credit VIX Indices, which aim to measure market expectations of future credit volatility.

The Credit VIX Indices provide a unique perspective on the credit markets.  Unlike other credit risk measures, such as CDS spreads, the Credit VIX Indices are forward looking in that they are designed to take into account the market's expectations of future volatility.  This makes the Credit VIX Indices potentially a valuable tool for market participants who want to identify market dislocations, hedge credit risk and make informed investment decisions.

Exhibit 1 shows the back-tested historical levels of the one-month Credit VIX Indices across the investment grade and high yield markets in North America and Europe.  Due to the greater credit risk inherent in the high yield indices, the reactions of the VIXHY and VIXXO indices to some of the key events in credit markets is relatively more pronounced.  

How to Read the Credit VIX

The Credit VIX indices are intended to provide an annualized expected volatility number for the underlying CDS index spread changes in bps.  The Credit VIX index levels can be used to calculate the expected range of the underlying CDS index spread changes over the respective Credit VIX tenors of one, three and six months.

As an illustration of a theoretical calculation of the iTraxx/Cboe Europe Main 1-Month Volatility Index, assuming a VIXIE level of 30 bps and the iTraxx Europe Main Index spread of about 75 bps on a given day, the index methodology measures the market’s expectation of the spread range of iTraxx Europe Main Index over the next one month to be roughly between  bps and bps.  The division of the VIXIE level by the square root of 12 is used to convert the annualized VIXIE level to a monthly expected volatility number.

pdf-icon PD F Download Full Article

Processing ...