IN THIS LIST

Credit VIX®: A New Tool for Measuring and Managing Credit Risk

Fueling the Energy Transition: S&P Global Essential Metals Producers Index

FAQ: Cboe S&P 500 Dispersion Index

An Overview of Return Types for Insurance Indices

A Closer Look at the SAR Government Sukuk Market

Credit VIX®: A New Tool for Measuring and Managing Credit Risk

Contributor Image
Srichandra Masabathula

Director, Fixed Income Tradable Products

S&P Dow Jones Indices

Contributor Image
Nicholas Godec

Senior Director, Head of Fixed Income Tradables & Private Markets

S&P Dow Jones Indices

Introduction

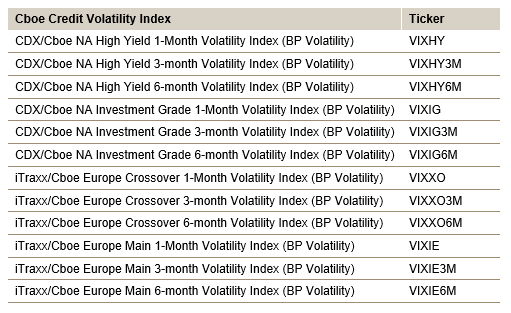
The Credit VIX Indices are a new set of benchmarks that seek to measure the expected volatility of credit spreads in North America and Europe over the next one, three and six months.  These indices use a modified methodology based on the Cboe® Volatility Index® (VIX) applied to swaptions based on S&P Dow Jones Indices’ (S&P DJI) iTraxx and CDX indices, European-style credit default swap index options, aggregating prices across different maturities and strike prices.  The result is a number representing expected volatility over different Credit VIX tenors.
Credit VIX®: A New Tool for Measuring and Managing Credit Risk: Exhibit 1

The four most liquid of S&P DJI’s CDS indices underlie the Credit VIX Indices: the CDX® North American High Yield Index (CDX.NA.HY), CDX® North American Investment Grade Index (CDX.NA.IG), iTraxx® Europe Main Index (iTraxx Europe) and the iTraxx® Europe Crossover Index (iTraxx Crossover).  The CDX.NA.IG/CDX.NA.HY and iTraxx Europe/iTraxx Crossover indices, each seek to track baskets of CDS in the North American and European investment grade and high yield markets, respectively.  These indices are highly liquid, with large trading volumes and tight bid-offer spreads. They are also transparent, widely followed and provide broad coverage of key market segments, while focusing on pure credit risk, as opposed to corporate bonds, which include an interest rate component.  This makes these indices a good starting point for the Credit VIX Indices, which aim to measure market expectations of future credit volatility.

The Credit VIX Indices provide a unique perspective on the credit markets.  Unlike other credit risk measures, such as CDS spreads, the Credit VIX Indices are forward looking in that they are designed to take into account the market's expectations of future volatility.  This makes the Credit VIX Indices potentially a valuable tool for market participants who want to identify market dislocations, hedge credit risk and make informed investment decisions.

Exhibit 1 shows the back-tested historical levels of the one-month Credit VIX Indices across the investment grade and high yield markets in North America and Europe.  Due to the greater credit risk inherent in the high yield indices, the reactions of the VIXHY and VIXXO indices to some of the key events in credit markets is relatively more pronounced.  

How to Read the Credit VIX

The Credit VIX indices are intended to provide an annualized expected volatility number for the underlying CDS index spread changes in bps.  The Credit VIX index levels can be used to calculate the expected range of the underlying CDS index spread changes over the respective Credit VIX tenors of one, three and six months.

As an illustration of a theoretical calculation of the iTraxx/Cboe Europe Main 1-Month Volatility Index, assuming a VIXIE level of 30 bps and the iTraxx Europe Main Index spread of about 75 bps on a given day, the index methodology measures the market’s expectation of the spread range of iTraxx Europe Main Index over the next one month to be roughly between  bps and bps.  The division of the VIXIE level by the square root of 12 is used to convert the annualized VIXIE level to a monthly expected volatility number.

pdf-icon PD F Download Full Article

Fueling the Energy Transition: S&P Global Essential Metals Producers Index

Contributor Image
Srineel Jalagani

Senior Director, Thematic Indices

S&P Dow Jones Indices

Introduction

Since our ancestors first discovered fire millennia ago, civilization’s continued expansion has been dependent on finding cheap and plentiful energy sources.  While much of our history has been dominated by the use of biomass as the primary fuel source, our move toward industrialization in the 18th century changed this in a couple of decades.  Cheap and abundant coal that drove the machines and factories of the Industrial Revolution was added to our energy mix.  More than a century passed before the transportation sector prompted another addition to our core energy sources: oil.

We have doubled our energy consumption over the past 40 years, something that took us a century to do during the 1800s. This growing demand for energy, combined with a heavy dependence on non-renewable sources, has been the norm until recently.  Increased climate change awareness and rising levels of greenhouse gas emissions have driven a call to action to curb our dependence on fossil fuels.  Additionally, diversifying our energy mix to increase the use of renewable energy sources is prudent risk management in economic terms.

Historically, adoption of new fuel sources came with a shift toward new technologies, like the steam powered machines of the 18th century and combustion engines of the 19th century.  However, the current energy transition we are witnessing is driven by our goal to reduce our carbon emissions, whereby innovative technologies are being embraced with an explicit purpose of diversifying our fuel sources.

Diversification within Transition

One feature of the Energy Transition playbook is the use of metals in various technology solutions to the problem.  Electrification entails demand for metals used in battery technology (lithium, cobalt, nickel), in electric vehicles (copper, aluminum) and in various industrial applications.  Increasing use of renewables in our electricity generation requires the input of metals in solar cells (copper, aluminum), wind turbines (copper, rare earth elements) and geothermal power plants (nickel, chromium).

Diverse technologies at play in the shift to low carbon energy sources require a diversified group of minerals (see Exhibit 1). Some metals like lithium and cobalt find their use in battery technologies, while others like copper and chromium have wider application areas.

Exhibit 1: Critical Mineral Needs for Clean Energy Technologies

pdf-icon PD F Download Full Article

FAQ: Cboe S&P 500 Dispersion Index

1. What is the Cboe S&P 500 Dispersion Index (DSPX)The Cboe S&P 500 Dispersion Index, also referred to as the Dispersion Index or DSPX, is an index that seeks to measure the expected dispersion in the S&P 500 over the next 30 calendar days, as calculated from the prices of S&P 500 index options and the prices of single-stock options of selected S&P 500 constituents, using a modified version of the VIX® methodology.

The index level reflects an annualized statistic. For example, an index level of 20 corresponds to an expectation for a standard deviation of 20% among the annualized returns of S&P 500 constituents over the next 30 days.

The index level is calculated every 15 seconds from 9:45 a.m. to 4:00 p.m. New York time during standard equity trading days.

2. What is dispersion?  Dispersion is a fundamental measure of risk and opportunity in the stock market. It measures how differently stocks are performing or are expected to perform.

Like volatility and VIX, we may measure dispersion historically or derive an expectation-based measure from the options market. DSPX is an expectation-based measure.

3. What does DSPX measure?  The index measures market expectations for dispersion by comparing the prices of S&P 500 constituent stock options and S&P 500 index options with maturities around 30 calendar days.

A complementary measure to market volatility—which measures overall fluctuations in stock averages like the S&P 500—the Dispersion Index measures broad expectations for fluctuations in stocks over and above their participation in market volatility over a short-term horizon.

4. What causes DSPX to rise or decline?  The index level rises when single-stock option prices increase relative to index option prices. The index level declines when single-stock and index option prices move closer in price.

The relative cost of stock and index options is driven, theoretically, by the magnitude of expected additional movement in single stocks compared to their index. Accordingly, the level of DSPX is expected to rise and fall together with market expectations for the magnitude of “opportunity” for outperformance via active stock selection among the S&P 500’s constituents.

5. Why was DSPX created?  The index was developed in collaboration between Cboe and S&P Dow Jones Indices (S&P DJI), applying the VIX methodology to both single-security and index options in order to create a high frequency indicator. The index may offer:

  • A measure of short-term S&P 500 dispersion expectations;
  • A benchmark for the evaluation of contracts linked to large-cap U.S. equity dispersion; or
  • An indicator of the short-term tracking error that active portfolio managers benchmarked to the S&P 500 may generate through stock selection.

6. What are the inputs to DSPX?  The level of the index is determined by the differences in prices of options on selected S&P 500 constituents and the prices of S&P 500 index options, as well as the weights of each constituent in the S&P 500 and representative interest rates for the period to maturity of all options included in the calculation.

    pdf-icon PD F Download Full Article

    An Overview of Return Types for Insurance Indices

    Contributor Image
    Kevin Patalano

    Senior Analyst, Multi-Asset Indices

    S&P Dow Jones Indices

    Contributor Image
    Maxime Fouilleron

    Analyst, Multi-Asset Indices

    S&P Dow Jones Indices

    Introduction

    Indices, including those used in insurance products, such as fixed index annuities (FIAs), registered index-linked annuities (RILAs) and index universal life (IUL), use one of these three return types: price return (PR), total return (TR) or excess return (ER).  These return types serve different purposes and are ultimately an element to consider as part of the overall construction of an index.

    Price return measures the capital appreciation (or depreciation) of an asset.  For an index, the price return measures the price fluctuations in the underlying constituents within the index.

    Total return measures the price return of an asset with dividends added.  As dividends are issued by underlying index constituents, the dividend amounts are theoretically reinvested in the underlying asset, which incrementally increases exposure to the underlying asset.  As more dividends are issued, more shares of the underlying asset are added to the index (or theoretically “purchased”), which in turn generates dividends paid on the original investment as well as these new shares, which are then again used to “buy” even more shares.

    Indices used in insurance products often contain exposure to an underlying equity index as well as a cash allocation.  A total return index used with insurance products would also typically include the theoretical return on the cash component if the index has a cash allocation invested at a certain rate, such as the Secured Overnight Financing Rate (SOFR), the federal funds rate or the yield on a 3-month U.S. Treasury bill.

    Excess return is often surrounded by confusion, since it can have different meanings depending on the context.  To simplify the term, we are going to break “excess return” down into two definitions.  

    In its simplest form, excess return measures a return above some sort of baseline.  The math is the same in both definitions, but the reason for using excess return can differ based on the industry.  

    • In the world of active management, excess return can be defined as the return above a benchmark, or “alpha”. Active managers of ETFs, mutual funds and hedge funds often measure the performance of their fund against a benchmark, like the S&P 500®.  Their goal is often to create as much alpha as possible.  In other words, they are looking to “beat the market.”
    • In the world of indices used with insurance products (e.g., FIAs, RILAs and IUL), excess return measures the return of one or more underlying assets minus an interest rate. This interest rate is subtracted to help improve hedge efficiencies, often leading to cost savings for the insurance carrier, which may ultimately benefit the end policyholder.

    It is worth noting that the term “excess return” is sometimes used as shorthand for “excess total return” or “excess price return” in the insurance space.  Most indices underlying insurance products are excess total return indices, meaning the theoretical interest rate is subtracted from the total return of the underlying assets in the index.  However, excess price return indices also exist in the insurance marketplace.  For the purposes of this piece and in order to align with the S&P Dow Jones Indices naming conventions, “excess return” will be used to refer to “excess total return.”

    It is not possible to invest directly in an index.  Exposure to an asset class represented by an index may be available through investable instruments based on that index.

    pdf-icon PD F Download Full Article

    A Closer Look at the SAR Government Sukuk Market

    Contributor Image
    Jessica Tan

    Principal, Fixed Income Indices

    S&P Dow Jones Indices

    Introduction

    The iBoxx Tadawul SAR Government Sukuk & Bond Index was launched in 2020 in collaboration with the Saudi Stock Exchange (Tadawul) to track the performance of Saudi Arabian riyal (SAR) denominated domestic government bonds, including sukuk issued by Saudi Arabia.  The index seeks to track SAR-denominated fixed coupon bonds that have an amount outstanding of at least SAR 100 million.  As the Saudi government continues to enhance the accessibility and infrastructure of its domestic debt market through various initiatives such as the Primary Dealers Program, the index, which combines Tadawul’s market data with iBoxx indexing capabilities, provides transparency for the market and could serve as a market benchmark for domestic and international investors.

    Evolution of the Market

    At launch, the index had a significant portion of conventional debt in addition to sukuk.  It started out with 22 bonds (SAR 79.50 billion in amount outstanding, or 35% of the total) and gradually reduced to 7 bonds as of August 2023 (SAR 13.96 billion, or 3% of the total outstanding).  The portion of bonds within the iBoxx Tadawul SAR Government Sukuk & Bond Index has shrunk as the demand for Shariah-compliant instruments for domestic Islamic banks’ liquidity management purposes has favored sukuk over conventional bond issuances. 

    The Saudi Arabia domestic government sukuk market, as represented by the iBoxx Tadawul SAR Government Sukuk Index in Exhibit 1, has been growing steadily over the past few years, with most of the expansion occurring between 2019 and 2022, cementing the Saudi government’s position as the largest sovereign sukuk issuer globally.  Due to market volatility, interest rate changes and a surge in crude oil prices in 2022, Saudi Arabia, the largest oil exporting country in the world, has reduced its domestic debt issuances since 2022.  Since the index's inception (June 30, 2019), the number of sukuk has increased from 29 to 50 and the total notional outstanding has increased from SAR 146.95 billion to SAR 433.18 billion.

    Exhibit 1: Growth of the SAR Government Sukuk and Bond Market

    pdf-icon PD F Download Full Article

    Processing ...