IN THIS LIST

A Closer Look at the SAR Government Sukuk Market

Reflecting on 25 Years of the S&P/TSX Index Series and Its Impact on the Canadian Investment Industry

TalkingPoints: The S&P 500® Sector-Neutral FCF Index — Why Free Cash Flow is King

TalkingPoints: Tracking Covered Calls in the Australian Stock Market

A Deep Dive into Sustainability Sector Indices

A Closer Look at the SAR Government Sukuk Market

Contributor Image
Jessica Tan

Principal, Fixed Income Indices

S&P Dow Jones Indices

Introduction

The iBoxx Tadawul SAR Government Sukuk & Bond Index was launched in 2020 in collaboration with the Saudi Stock Exchange (Tadawul) to track the performance of Saudi Arabian riyal (SAR) denominated domestic government bonds, including sukuk issued by Saudi Arabia.  The index seeks to track SAR-denominated fixed coupon bonds that have an amount outstanding of at least SAR 100 million.  As the Saudi government continues to enhance the accessibility and infrastructure of its domestic debt market through various initiatives such as the Primary Dealers Program, the index, which combines Tadawul’s market data with iBoxx indexing capabilities, provides transparency for the market and could serve as a market benchmark for domestic and international investors.

Evolution of the Market

At launch, the index had a significant portion of conventional debt in addition to sukuk.  It started out with 22 bonds (SAR 79.50 billion in amount outstanding, or 35% of the total) and gradually reduced to 7 bonds as of August 2023 (SAR 13.96 billion, or 3% of the total outstanding).  The portion of bonds within the iBoxx Tadawul SAR Government Sukuk & Bond Index has shrunk as the demand for Shariah-compliant instruments for domestic Islamic banks’ liquidity management purposes has favored sukuk over conventional bond issuances. 

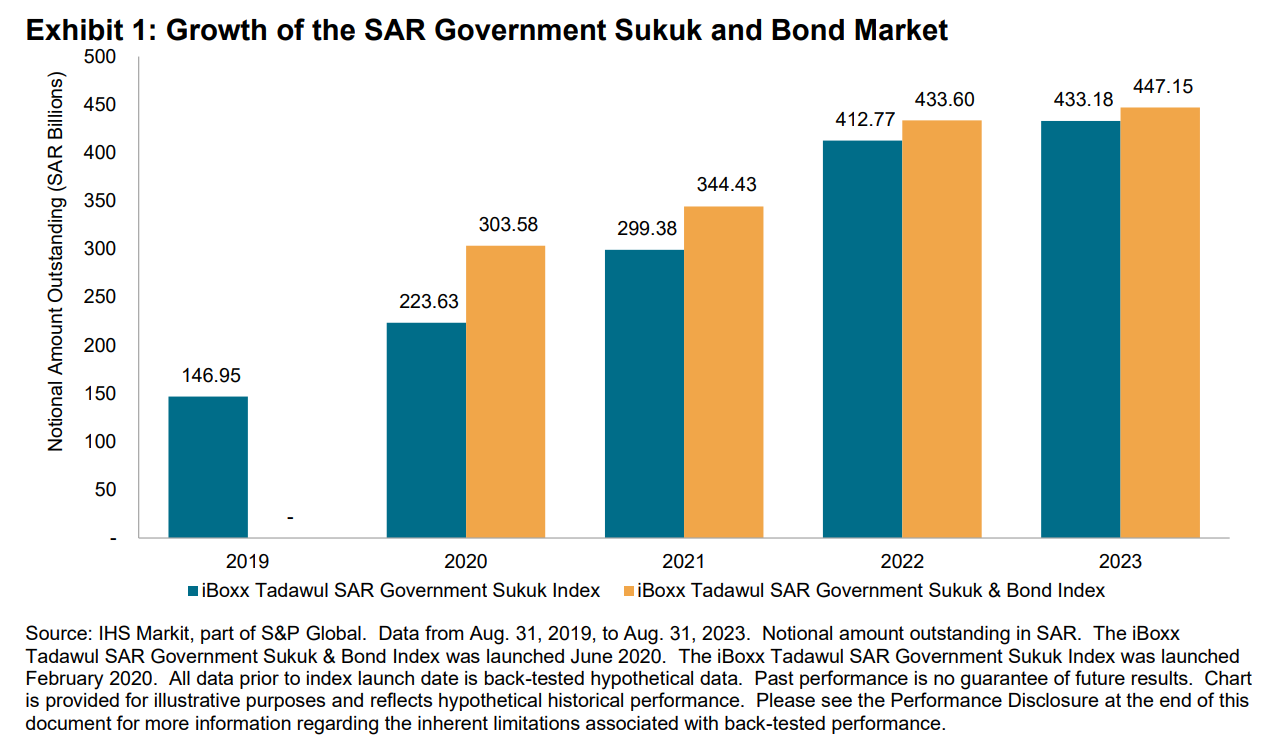
The Saudi Arabia domestic government sukuk market, as represented by the iBoxx Tadawul SAR Government Sukuk Index in Exhibit 1, has been growing steadily over the past few years, with most of the expansion occurring between 2019 and 2022, cementing the Saudi government’s position as the largest sovereign sukuk issuer globally.  Due to market volatility, interest rate changes and a surge in crude oil prices in 2022, Saudi Arabia, the largest oil exporting country in the world, has reduced its domestic debt issuances since 2022.  Since the index's inception (June 30, 2019), the number of sukuk has increased from 29 to 50 and the total notional outstanding has increased from SAR 146.95 billion to SAR 433.18 billion.

Exhibit 1: Growth of the SAR Government Sukuk and Bond Market

pdf-icon PD F Download Full Article

Reflecting on 25 Years of the S&P/TSX Index Series and Its Impact on the Canadian Investment Industry

Contributor Image
Michael Orzano

Head of Global Exchanges Product Management

S&P Dow Jones Indices

Contributor Image
Sean Freer

Director, Global Equity Indices

S&P Dow Jones Indices

Executive Summary

2023 marks a quarter century since S&P Dow Jones Indices (S&P DJI) and the TMX Group partnered to bring investors what is today an innovative and comprehensive suite of Canadian stock market indices.  As Canada’s most widely followed stock market indicators, the S&P/TSX Index Series serves as the de facto measure of value and performance for multiple segments of the nation’s stock market.

The past 25 years have seen significant market growth of the flagship S&P/TSX Indices, the S&P/TSX Composite Index and the S&P/TSX 60, and a transformation of how they are used.  Today, the indices serve an integral role in Canada’s investment infrastructure.  The asset management industry utilizes the S&P/TSX Composite Index and other related indices as the investable universe for active investment strategies and to benchmark fund performance.  Likewise, pension funds and other asset owners use the S&P/TSX Indices to benchmark their domestic portfolios.  With an estimated CAD 814 billion of Canadian equity funds benchmarked to S&P/TSX Indices, the series represents the most widely used benchmarks for Canadian equity funds by far.

Perhaps most importantly, the S&P/TSX Index Series served as the foundation for the growth of index-based investing in Canada.  The deep ecosystem of liquid financial products tracking key S&P/TSX Indices allows active and passive investors to express investment views in an efficient manner.  S&P DJI’s SPIVA® research has also shined a light on the inability of most Canadian fund managers to beat their benchmarks, further highlighting the benefits of passive investing.  As has occurred in other parts of the world, the growth of index investing has democratized investment solutions that were previously only available to large institutions and lowered the cost of investing for millions of Canadians.

The Evolution of the S&P/TSX Index Series

Beginning with the introduction of the S&P/TSX 60 on Dec. 31, 1998, the partnership between S&P DJI and TMX Group has resulted in the development of a broad suite of investable indices measuring Canadian equities, covering a range of market segments and themes.  Less than a year after the launch of the S&P/TSX 60, Barclays Global Investors listed what is today known as the iShares S&P/TSX 60 Index ETF, which is now the largest ETF in Canada in terms of assets invested.

The S&P/TSX Index Series subsequently evolved with the S&P/TSX SmallCap Index and the S&P/TSX Completion Index offering small- and mid-cap market benchmarks starting in 1999.  The years 2000 to 2002 saw the introduction of a suite of sector-focused indices, alongside S&P DJI introducing the Global Industry Classification Standard® (GICS®).  This development allowed investors to dissect market performance along sector lines and led to the creation of products linked to several Canadian sector indices beginning with the S&P/TSX Capped Energy and S&P/TSX Capped Financials.

To complement the traditional market-capitalization-weighted indices, the noughties also saw the development of equal-weighted indices and dividend-oriented indices.  The S&P/TSX Canadian Dividend Aristocrats® Index was the first to offer exposure to high-yielding Canadian companies, followed by the S&P/TSX Composite High Dividend Index.

The first Shariah-compliant index in Canada was established in 2008 with the launch of the S&P/TSX 60 Shariah.  The S&P/TSX 60 VIX® Index—known as the “fear barometer” of the Canadian market—launched in 2010 and measures implied equity market volatility.

pdf-icon PD F Download Full Article

TalkingPoints: The S&P 500® Sector-Neutral FCF Index — Why Free Cash Flow is King

Contributor Image
Rupert Watts

Head of Factors and Dividends

S&P Dow Jones Indices

Contributor Image
George Valantasis

Associate Director, Factors and Dividends

S&P Dow Jones Indices

While there are many metrics that can be used to evaluate the value of a company, free cash flow (FCF) is particularly useful when it comes to assessing financial health. FCF is the excess cash generated by a company after accounting for the cost of operations and capital expenditures. FCF may offer a clearer picture of a company’s profitability, since it is more difficult to manipulate than other measures such as net income.

Importantly, companies with plenty of FCF have the flexibility to pay cash dividends, buy back stock, pay down debt and pursue growth opportunities—all important undertakings from an investor's perspective.

The S&P 500 Sector-Neutral FCF Index is designed to track companies within the S&P 500 that exhibit high FCF yield relative to other companies within the same GICS® sector. By focusing on FCF yield, the index measures companies’ FCF generation relative to their value. Hence, it provides a means to track companies generating attractive levels of FCF that may be undervalued.

1. What is FCF?

Free Cash Flow = Net Cash from Operating Activities minus Capital Expenditures

FCF represents the amount of cash generated by a business (i.e., operating cash flow) over a given period after accounting for cash outflows to support operations and to maintain capital assets. Simply put, it is the excess cash that a company generates after accounting for the expenses to run the business.

2. Why is FCF an important metric for assessing a company?

FCF offers a deeper understanding into the financial health of a company, since it shows the amount of cash that a company receives after meeting its obligations. A company with ample FCF has the flexibility to increase shareholder value through strategic investments and acquisitions. Furthermore, FCF can be used to increase shareholder yield via cash dividends, buybacks and paying down of debt.

Companies producing plenty of FCF tend to be higher quality and may be better positioned to weather periods of market stress, as shown historically. Furthermore, in today’s environment of high interest rates, having a healthy cash flow has become particularly important since it reduces a company’s reliance on debt markets to finance business operations.

3. What potential improvements does FCF offer over other measures of profitability such as net income?

FCF differs from net income, which is used to calculate other popular valuation metrics such as the price-to-earnings ratio, since it focuses solely on cash transactions and is thus harder to manipulate. Under generally accepted accounting principles (GAAP) and accrual accounting, management is afforded more flexibility when recording sales and expenses. While FCF can still be manipulated (albeit to a lesser degree), it measures the exact amount of excess cash that was generated by the company in a given period. This is important because the capital returned via dividends or buybacks can only be funded with cash and not an accounting term such as “net income.”

pdf-icon PD F Download Full Article

TalkingPoints: Tracking Covered Calls in the Australian Stock Market

Contributor Image
Parth Shah

Director, Derivative Indices

S&P Dow Jones Indices

The term covered call refers to an option strategy in which the investor selling call options owns an equivalent amount of the underlying security. To execute a covered call, the investor holds an underlying position on individual stock(s) or an index-like position. In addition, the investor seeks to supplement their return by systematically selling calls against their long position(s) and collecting option premium.

A covered call strategy essentially is intended to transform a “growth” position (i.e., a long stock) to a “growth and income” play. The potential for larger gains longer term is in effect swapped out for immediate income. A systematic covered call strategy may contribute to consistent income generation especially during low volatility periods.

1. What is the S&P/ASX Buywrite Index

The S&P/ASX Buywrite Index is designed to measure the performance of a theoretical covered call strategy that is rebalanced quarterly and comprises a short position in the at-the-money (ATM) call option on the S&P/ASX 200 and a long position on the S&P/ASX 200.

2. What is a covered call strategy, and how does it work?

A covered call (or buy-write) strategy aims to generate income and mitigate loss, particularly in bear market conditions. Specifically, this strategy involves selling a call option against an underlying asset that is already owned by the option writer. If the asset’s market price exceeds the contract’s strike price at expiration, the call writer would be obligated to sell the underlying asset at the option strike price to the option buyer. If the strike price is not met, the option writer maintains control of the asset. Either way, the option writer generates income from selling the call contract — this is known as the “option premium.”

3. What are the potential advantages of this type of strategy?

The main potential benefit of this strategy is the income generation from accumulating call option premiums. One factor that affects these premiums is the “option moneyness” — that is whether the option contract is “in the money” (ITM), “out of the money” (OTM) or “at the money” (ATM). An OTM call has a strike price that is above the current market price. An ATM call has a strike price that is equal to the current market price of the asset — this generates a higher premium, as there is a greater chance that the option will be exercised at this price. These premiums offer supplemental income to traditional sources like dividends and fixed income. This income can be distributed or reinvested into the underlying asset to mitigate against losses in a bear market.

4. What are the potential disadvantages of this strategy?

A drawback of the covered call strategy occurs if a call option is ITM, in which case the option writer would miss out on any gains that the asset may achieve beyond the strike. The option seller would be forced to sell the asset at this lower price, therefore capping the asset’s growth potential. This often occurs during bull markets, as the market price of the underlying asset increases above the option strike price. A long-term covered call strategy may help make up for this by offering income that can be used to reinvest into the asset.

pdf-icon PD F Download Full Article

A Deep Dive into Sustainability Sector Indices

Contributor Image
Stephanie Rowton

Director, Head of Sustainability Indices EMEA

S&P Dow Jones Indices

Introduction

Investing in sectors has grown dramatically over recent years, as investors look to express a view on the broader economic conditions while maintaining diversification and mitigating single-stock risk.  Additionally, there has been an increase in market participants looking to allocate strategically to sustainability.  Many are starting to look for ways to integrate sustainability values into their investments through more precise tools such as sector allocation. S&P Dow Jones Indices (S&P DJI) has introduced a suite of sustainability sector indices, including the S&P ESG Enhanced Sector Indices and S&P Sustainability Enhanced Sector Indices, to meet this need.  By utilizing S&P DJI ESG Scores, business activity exclusions, UN Global Compact (UNGC) exclusions, daily controversy monitoring and S&P Global Trucost carbon data, our sustainability sector indices have historically offered a meaningful improvement in ESG profile and carbon emissions profile against their non-ESG underlying index.

A Deep Dive into Sustainability Sector Indices: Exhibit 1

S&P DJI ESG Scores

The S&P DJI ESG Scores are derived from over 22 years of detailed sustainability data from the industry leading sustainability assessment, the S&P Global Corporate Sustainability Assessment (CSA).  The CSA is an annual evaluation of companies’ sustainability practices.  A key feature of the CSA is that, through optional active participation in the assessment, companies can disclose additional details to our analysts beyond what is publicly available.  This engagement opportunity, coupled with the granularity of the CSA, enables S&P Global to provide a holistic and complete view of a company’s sustainability profile; differentiating the S&P DJI ESG Scores from other ESG scores that rely solely on data from public sources.  A company’s active participation in the CSA allows S&P Global to collect between 600 and 1,000 data points per company, which feed into the S&P DJI ESG Scores (see Exhibit 2).

A Deep Dive into Sustainability Sector Indices: Exhibit 2

The CSA and the derived S&P DJI ESG Scores are driven by materiality analysis considering both financial materiality and how sustainability criteria present a significant impact on society or the environment.  Material sustainability criteria have the potential to significantly influence an entity's business value drivers, including, for example, business operations, cash flows, legal or regulatory liabilities and access to capital.  Furthermore, sustainability criteria have the capability to significantly improve or undermine an entity’s reputation and relationships with key stakeholders and society, including the environment.  Therefore, companies are assessed according to the sustainability issues that are weighted according to the magnitude and likelihood of their impact on enterprise value creation and external stakeholders, including the economy, the environment and people.  Collecting and scoring data according to these factors ensures that companies have been measured based on the sustainability issues that are most relevant to them.  The examples in Exhibit 3 show how weights assigned to issues in different industries can vary greatly.

pdf-icon PD F Download Full Article

Processing ...