S&P Global Offerings
Featured Topics
Featured Products
Events
S&P Global Offerings
Featured Topics
Featured Products
Events
S&P Global Offerings
Featured Topics
Featured Products
Events
S&P Global Offerings
Featured Topics
Featured Products
Events
Corporations
Financial Institutions
Banking & Capital Markets
Economy & Finance
Energy Transition & Sustainability
Technology & Innovation
Podcasts & Newsletters
Corporations
Financial Institutions
Banking & Capital Markets
Economy & Finance
Energy Transition & Sustainability
Technology & Innovation
Podcasts & Newsletters
Research — 13 Dec, 2023

By Keith Nissen
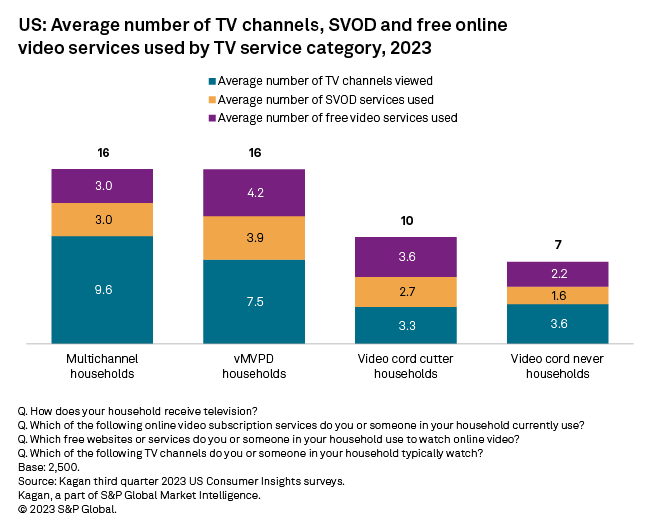
Subscribers to virtual multichannel TV services watch eight TV channels, on average, compared to 10 TV channels for traditional multichannel TV households, according to a recent Kagan US Consumer Insights survey. Video cord cutters and cord nevers who receive over-the-air local broadcast TV programming report watching three to four TV channels.

➤ Both traditional and virtual multichannel TV households receive their digital entertainment from 16 TV channels and online video services, on average. The difference is that virtual multichannel TV subscribers tend to use more subscription video on demand and free online video services than traditional multichannel households.
➤ The majority of households in all four user groups examined here — traditional and virtual multichannel TV households as well as video cord cutters and nevers — tend to subscribe to Netflix, Amazon Prime Video and/or Hulu. A significant portion of virtual multichannel TV households and cord cutters/nevers are likely to subscribe to Disney+.
➤ Video cord-never households use significantly fewer SVOD and free online video services than other household types.
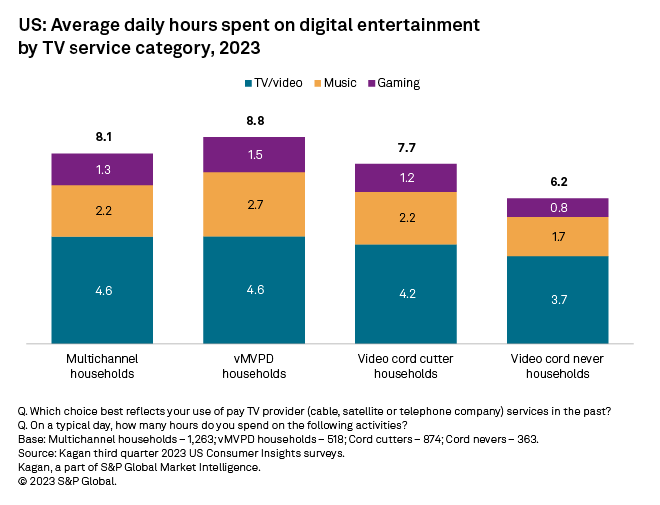
➤ Average time spent watching TV/video content by traditional and virtual multichannel TV subscribers is the same at nearly five hours per day. Cord-cutter and cord-never households tend to spend about four hours per day.

Respondents to the Kagan third-quarter 2023 US Consumer Insights survey were asked which TV channels they typically watch as well as what subscription video services and free online video services they use. The survey results reveal that, overall, traditional multichannel and virtual multichannel households both receive their TV/video entertainment from 16 TV channels or video services, on average. Traditional multichannel TV households typically watch 10 TV channels as well as content from three SVOD and three free video services. Virtual multichannel TV households tend to watch slightly fewer TV channels (eight) but use an average of four SVOD and four free video services.
Overall, video cord-cutter households that only receive over-the-air (OTA) broadcast TV programming (no virtual multichannel TV subscription) get their TV/video entertainment from 10 TV channels or online video services, which is substantially higher than video cord nevers (seven). Cord-cutter and cord-never households that receive OTA broadcast TV both watch an average of three to four local TV channels. However, the data shows that video cord cutters use more SVOD and free online video services than cord-never households.
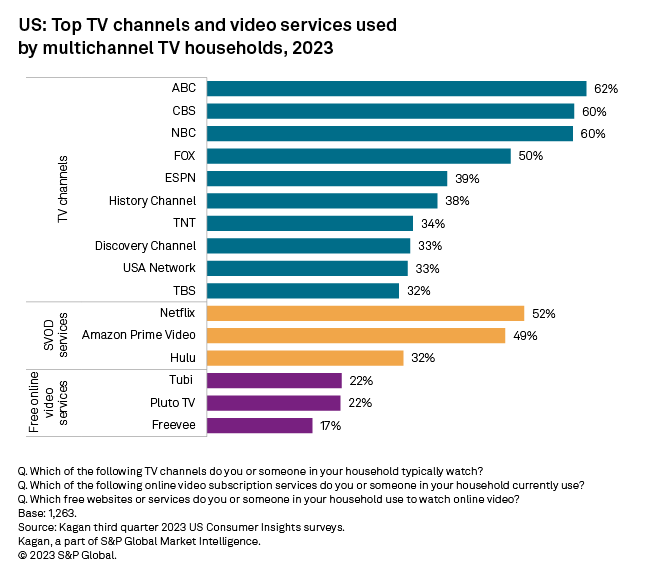
The survey found that among traditional multichannel TV subscribers, the four major broadcast TV networks each garnered at least 50% viewership. The remainder of the top 10 TV channels viewed by multichannel TV subscribers were cable TV channels, each with about one-third viewership. The top three SVOD services used by multichannel TV households included Netflix, Amazon Prime Video and Hulu. The three most popular free online video services among multichannel TV households included Tubi, Pluto TV and Freevee.
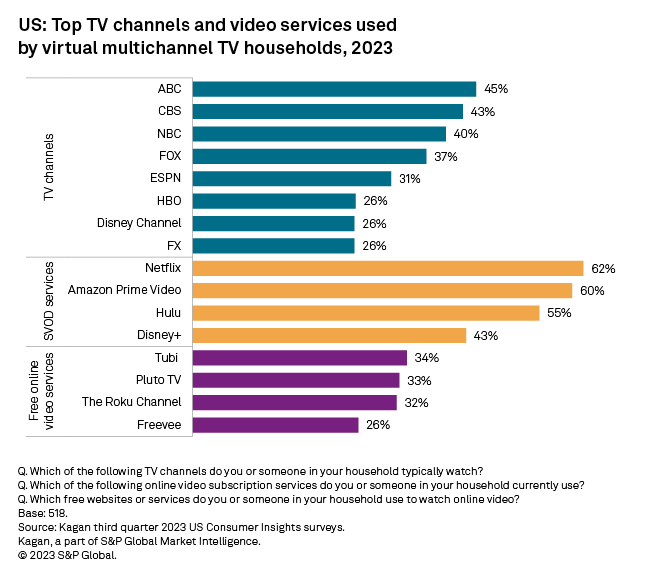
The top five popular TV channels among virtual multichannel TV subscribers were identical to traditional multichannel households, consisting of the four major broadcast TV channels, along with ESPN. Whereas traditional multichannel households favor watching content from the History Channel and TNT, virtual multichannel subscribers prefer watching HBO and the Disney Channel. The survey data also shows that virtual multichannel subscribers, overall, tend to subscribe to SVOD services more than traditional multichannel households, especially services such as Hulu and Disney+. Virtual multichannel homes are also much more inclined than traditional multichannel households to watch content from free online video services, including The Roku Channel.
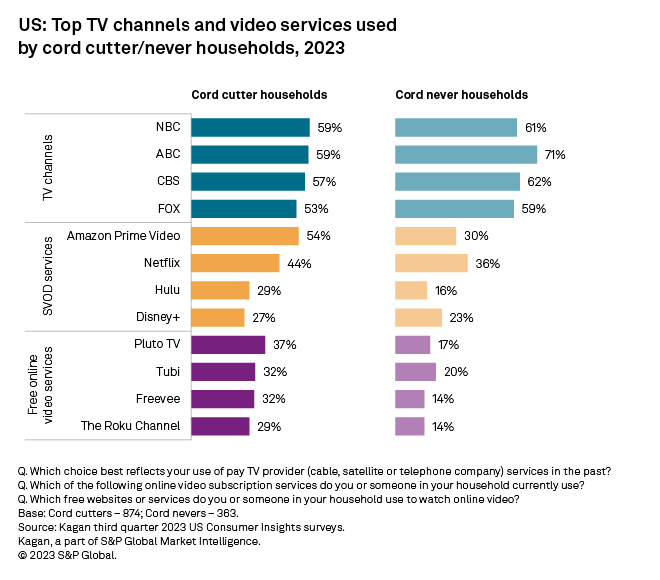
The majority of both video cord cutters and cord nevers that receive OTA broadcast TV programming watch all four major local TV broadcast networks. The survey data indicates that cord-cutter households are more likely to use major SVOD services such as Netflix, Amazon Prime Video and Hulu than cord nevers. Approximately one-quarter of households in both categories reported subscribing to Disney+. Similarly, the use of free video services by cord cutters mirrors that of virtual multichannel TV households but is substantially higher than video cord nevers.
Examining total daily consumption hours of digital entertainment across the user groups shows that virtual multichannel TV subscribers spend nearly nine hours per day on digital entertainment, slightly higher than traditional multichannel TV subscribers. However, time spent watching TV/video is identical at 4.6 hours per day, on average. The survey data shows that virtual multichannel subscribers spend more time listening to music and playing games than traditional multichannel subscribers.
Overall, video cord cutters that receive OTA broadcast TV programming spend slightly less time per day on digital entertainment (nearly eight hours on average) than traditional or virtual multichannel TV subscribers. Time spent watching TV/video content is also less than both traditional and virtual multichannel TV households. Time spent listening to music and playing games is lower than virtual multichannel TV households but very similar to traditional multichannel TV subscribers.
Video cord nevers that receive OTA broadcast TV programming spend an average of approximately six hours per day on digital entertainment. Cord nevers tend to spend slightly less time per day watching TV/video content than cord cutters, with substantially less time for music and games. This is consistent with the conclusion that cord-never households generally tend to be less interested in video entertainment than other household types.
The Kagan US fall Consumer Insights survey was conducted during September 2023, consisting of 2,500 internet adults. The survey has a margin of error of +/-3 ppts at the 95% confidence level. Percentages are rounded to the nearest whole number. Survey data should only be used to identify general market characteristics and directional trends.
To submit direct feedback/suggestions on the questions presented here, please use the "feedback" button located above, directly under the title of this article. Note that while all submissions will be reviewed and every attempt will be made to provide pertinent data, Kagan is unable to guarantee inclusion of specific questions in future surveys.
Consumer Insights is a regular feature from Kagan, a part of S&P Global Market Intelligence.
This article was published by S&P Global Market Intelligence and not by S&P Global Ratings, which is a separately managed division of S&P Global.