


Research — 6 Jul, 2022
US video cord nevers are very similar yet quite different

By Keith Nissen
Introduction
Kagan Consumer Insights survey results show that U.S. video cord nevers — households that have never subscribed to a traditional multichannel TV service — share many common characteristics but fall into two main groups: one that prefers live TV and another that favors video on demand.

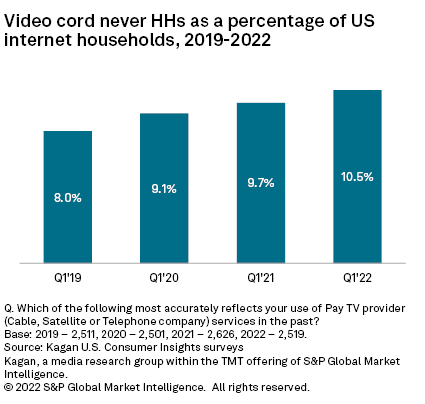
* Kagan's first-quarter 2022 Consumer Insights survey results revealed that cord never households reached over 10% of total U.S. internet households — up from only 8% in the 2019 survey.
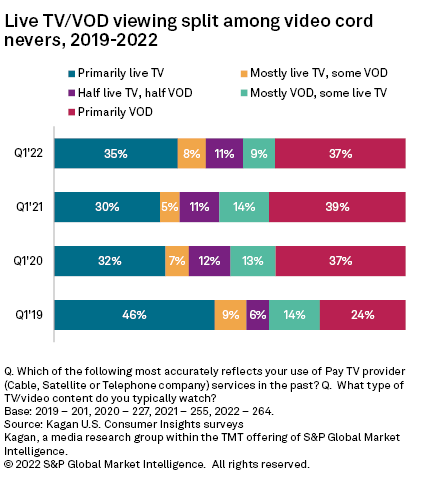
* More than one-third of U.S. cord nevers watch primarily live TV, and 37% watch primarily on-demand video — a significant gain from the 24% watching mostly on demand in 2019.
* Live TV-centric cord never households tend to be older adults (Gen Xers, baby boomers/seniors). VOD-centric cord nevers tend to be Gen Z adults and millennials.

The Kagan U.S. Consumer Insights surveys have documented the ongoing video cord-cutting trend where this year, one-quarter (25%) of internet households now call themselves former multichannel TV subscribers. Cord never households grew to over 10% of internet households in 2022, up 2.5 percentage points over the past three years. The growth of cord nevers comes primarily from newly formed Gen Z adult households but is somewhat mitigated each year by older adult households (mainly millennials) that subscribe to a pay TV service for the first time.
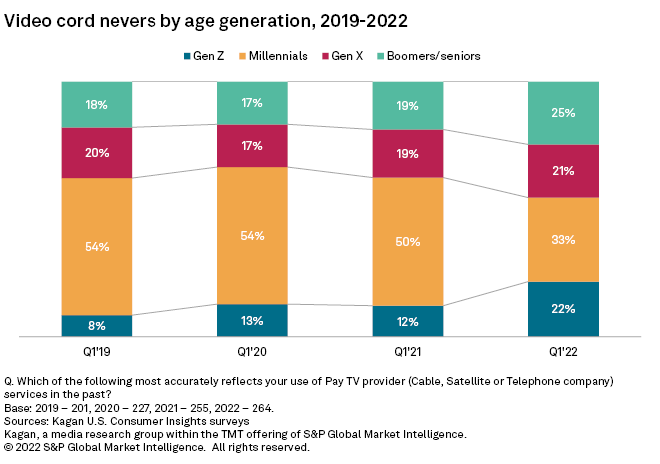
Historical survey data reveals that from 2019-2021, the age demographics of cord nevers remained largely unchanged. Over this period, Gen Z adults and millennials accounted for approximately two-thirds of U.S. cord nevers, with the remaining one-third split fairly evenly across Gen Xers and older baby boomers/seniors. In 2022, the age distribution of cord nevers showed a dramatic increase in the percentage of Gen Z adults and a corresponding decrease in millennials. The percentage of Gen Xers and baby boomers/seniors remained generally in line with historical trends. This suggests that a larger portion of millennials than normal subscribed to a traditional multichannel service for the first time during 2021, thereby decreasing the overall percentage of millennials that are cord nevers. In contrast, fewer Gen Z adult households reported subscribing to a pay TV service in 2021, choosing to remain cord nevers.
Over the years, cord nevers have been generally characterized as being less interested in TV/video entertainment than current or past pay TV subscribers. However, this is changing. For example, in 2019 cord nevers spent an average of 6.6 hours per day on digital entertainment (video/music/games) compared to a national average of 7.8 hours per day. This year, cord nevers reported spending 8.1 hours per day on digital entertainment, essentially matching the national average of 8.2 hours per day. However, the survey found that cord nevers still use only 2.6 online subscription video-on-demand services compared to 3.6 SVOD services for U.S. internet households overall. They also use only 1.8 free advertising-supported video-on-demand services, far lower than the national average of 3.2 AVOD services.
The TV viewing behavior of cord nevers shows that they fall into two main groups. Over the past two years, approximately one-third of cord nevers have reported that they watch primarily live TV and another one-third have indicated that they watch primarily on-demand video. Understanding this dichotomy is important to online video service providers looking to cord never households for new viewers.
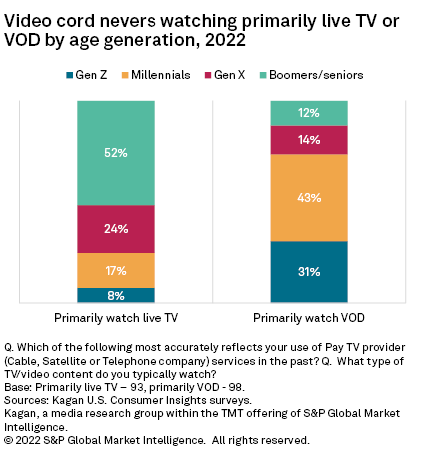
In 2022, three-quarters (76%) of the cord nevers who favor watching live TV are older adults (Gen Xers, baby boomers and seniors), while 74% of those who favor watching on-demand video are younger adults (Gen Zers and millennials). This reinforces the need for online video service providers to focus any marketing efforts toward the younger, VOD-centric cord nevers rather than older, live TV-centric cord-never households.
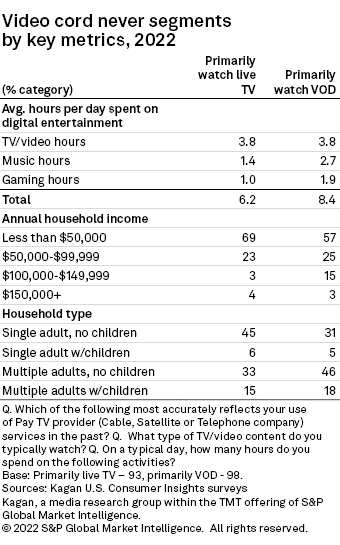
Cord nevers that watch primarily VOD differentiate themselves from those that watch primarily live TV in numerous ways. VOD-centric cord nevers spend over eight hours per day, on average, consuming digital entertainment, compared to only six hours for live TV-centric cord nevers. Interestingly, each group spends the same amount of time each day watching TV/video content (3.8 hours), with VOD-centric cord nevers spending approximately twice the time listening to music and playing games as their live TV-centric counterparts.
Cord nevers tend to have lower household incomes than current or previous pay TV subscriber households. Nearly seven in 10 live TV-centric cord nevers report having an income less than $50,000 per year, with 51% residing in a single adult household and 78% in households without children. The majority (57%) of VOD-centric cord-never households earn less than $50,000 per year, but this segment also includes 18% that earn at least $100,000 annually compared with only 7% of live TV cord nevers. Approximately two-thirds (64%) of VOD-centric cord nevers live in multi-adult households, but overall, 77% live in households without children.
The Kagan U.S. Consumer Insights surveys were conducted from first quarter 2019 to first quarter 2022, with approximately 2,500 internet adults per survey wave. Each survey has a margin of error of +/-1.9 percentage points at the 95% confidence level. Percentages are rounded to the nearest whole number. Survey data should only be used to identify general market characteristics and directional trends. Gen Z adults are ages 18-24; millennials, aqes 25-41; Gen Xers, ages 42-56; and baby boomers/seniors are adults aged 57+.
Consumer Insights is a regular feature from Kagan, a media research group within S&P Global Market Intelligence's TMT offering, providing exclusive research and commentary.
This article was published by S&P Global Market Intelligence and not by S&P Global Ratings, which is a separately managed division of S&P Global.