S&P Global Offerings
Featured Topics
Featured Products
Events
S&P Global Offerings
Featured Topics
Featured Products
Events
S&P Global Offerings
Featured Topics
Featured Products
Events
Banking & Capital Markets
Economy & Finance
Energy Transition & Sustainability
Technology & Innovation
Podcasts & Newsletters
Banking & Capital Markets
Economy & Finance
Energy Transition & Sustainability
Technology & Innovation
Podcasts & Newsletters
S&P Global Offerings
Featured Topics
Featured Products
Events
Research — 8 Nov, 2023

By Keith Nissen
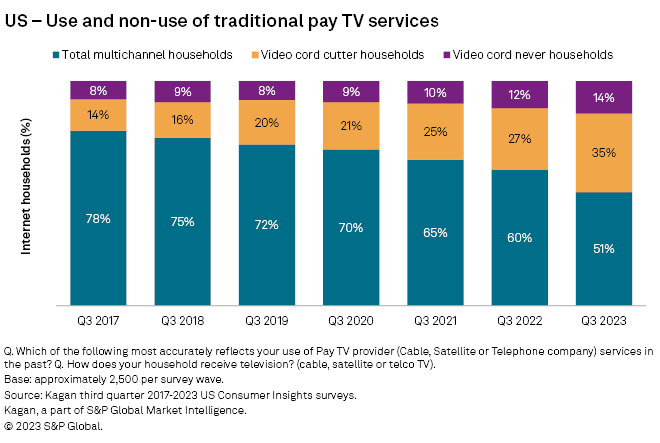
Results from the third-quarter 2023 Kagan US Consumer Insights survey reveal that the US video cord cutting trend appears to have accelerated during 2023, with consumers continuing to access their favorite TV programming from more economical virtual pay TV or free online video services.

➤ The percentage of US households that have dropped their traditional pay TV subscription rose eight percentage points to 35% year-over-year, according to Kagan US Consumer Insights surveys.
➤ Over 40% of recent video cord cutters still report watching primarily or mostly live TV, suggesting that for many, dropping a traditional pay TV service does not imply they wish to alter their TV viewing behavior.
➤ Survey data shows that viewing over-the-air (OTA) broadcast TV programming has declined, in favor of virtual pay TV services and expanded use of free online video services.

Video cord cutting in the US appears to be escalating. A comparison of historical data from Kagan US Consumer Insights surveys over the past six years shows that up through 2022, video cord cutter households grew at a very steady pace, rising around 2 percentage points per year. However, during 2023, the survey data reveals that US video cord cutter households expanded by 8 percentage points year over year. As of third quarter 2023, traditional pay TV subscribers declined to 51%, while 35% of total US internet households have dropped their traditional pay TV subscription without replacing it. Since 2017, video cord nevers (those who have never subscribed to a traditional pay TV service) expanded to 14% of overall US internet households.
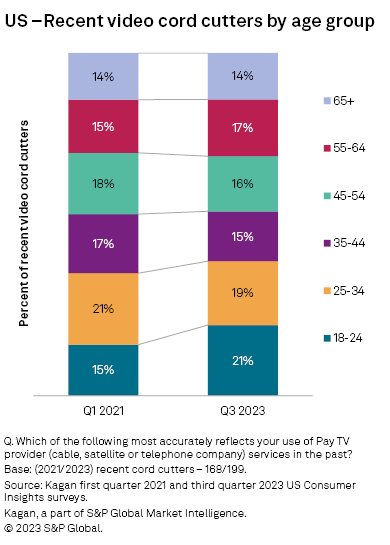
One thing that has not changed much over the past three years is that adults of all age groups are cutting the video cord. A comparison of recent video cord cutters, defined as households that dropped their traditional pay TV subscription over the past twelve months, shows a fairly even distribution across age groups as well as an age distribution that is generally consistent over time.
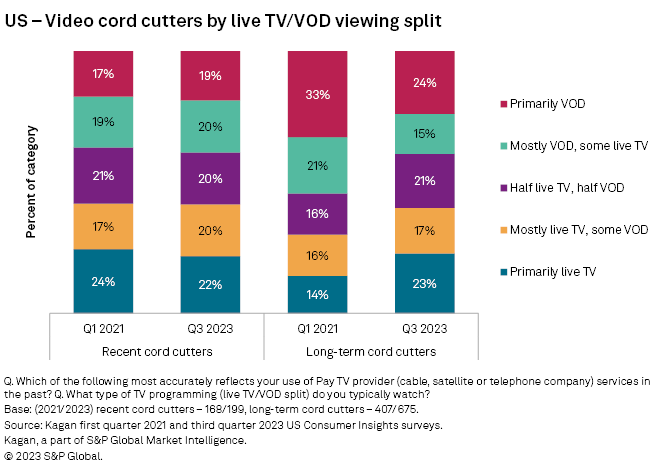
The TV/online video viewing behavior of recent video cord cutters also appears to be very consistent over time. For instance, the survey data shows that in 2021, 41% of recent video cord cutters reported watching either primarily live TV or mostly live TV content compared to 42% in 2023. Similarly, 36% of recent video cord cutters in 2021 said they watched mostly video on demand, or primarily VOD content, compared to 39% in 2023. Live TV viewing for cord-cutter homes implies either receiving OTA broadcast TV programming, subscribing to a virtual pay TV service, such as Sling TV or streaming live online video. Viewing VOD content implies watching time-adjusted video content from either subscription video on demand (SVOD) or free online video services.
The survey data also shows how the TV/video viewing behavior of recent cord cutters has impacted long-term cord cutters over time. In 2021, 30% of long-term cord cutters, those who dropped their traditional pay TV service over one year ago, reported watching either primarily live TV or mostly live TV. By 2023, the percentage of long-term cord cutters with this TV/video viewing behavior had grown eleven percentage points to 41%. In contrast, the majority (51%) of long-term cord cutters in 2021 said they watched mostly or primarily VOD content, declining to 39% three years later. This suggests that there has been a shift among video cord cutters toward watching more live TV, and less VOD content.
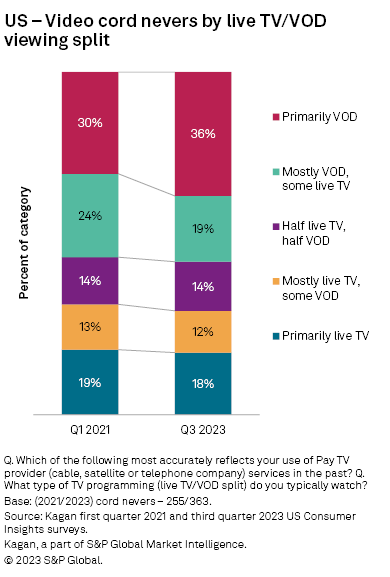
Yet, the same trend toward higher levels of live TV viewing has not been found among video cord never households. In 2021, 31% of video cord nevers said they watched primarily or mostly live TV, compared to 30% in 2023. Additionally, the data shows that video cord nevers remain VOD-centric viewers with the majority reporting they watch mostly or primarily VOD content in both 2021 (54%) and 2023 (55%).
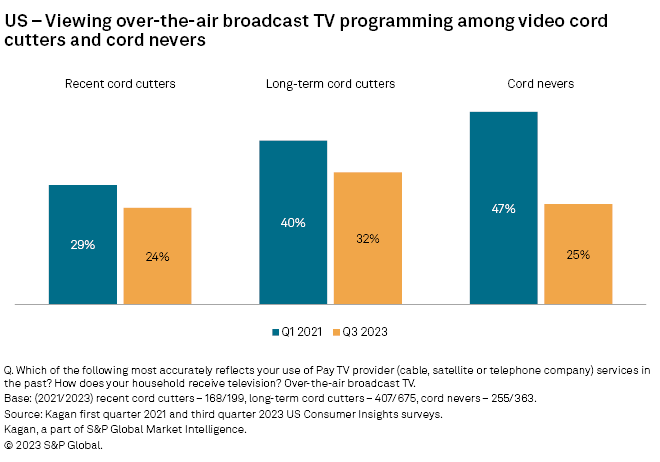
Digging a bit deeper into the trend toward watching more live TV, the survey data reveals that the percentage of both recent and long-term cord cutters that view OTA broadcast TV programming is declining. OTA broadcast TV viewing among recent cord cutters fell 5 percentage points over the past three years to 24%, while viewing among long-term cord cutters dropped 8 percentage points to 32% in 2023. Furthermore, OTA viewing among cord nevers plunged a whopping twenty-two percentage points since 2021, implying that cord nevers are increasingly accessing live TV programming from other sources.
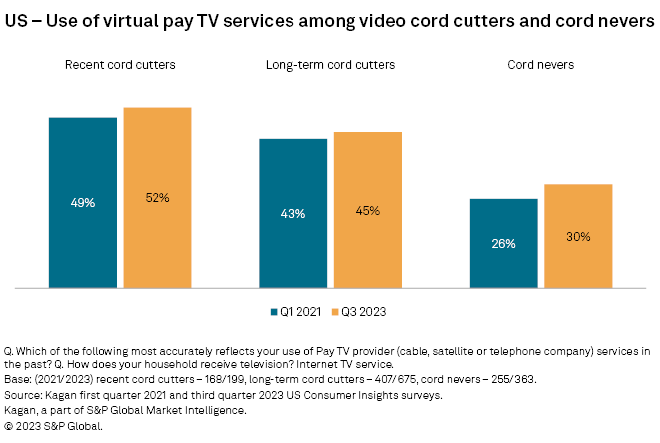
Virtual pay TV services, such as Sling TV or Hulu with Live TV, are online video services that carry most of the same cable TV channels offered on traditional pay TV services, but with a lower monthly subscription price. This has made them an attractive alternative for price-sensitive households that do not wish to give up their favorite cable TV programs. The historic survey data shows that about half of recent cord cutters and 45% of long-term cord cutters typically subscribe to a virtual pay TV service. With approximately four in 10 recent cord cutters watching primarily or mostly live TV, it is very possible that these adults have traded their traditional pay TV service for a virtual online pay TV service without altering the TV/video viewing behavior much at all.
Once again, cord nevers differentiate themselves from their cord cutter brethren by a much lower use of virtual pay TV services. Less than one-third (30%) of cord nevers in 2023 said they have a virtual pay TV subscription, up only 4 percentage points from 2021. This data appears to be consistent with the preference among cord nevers to watch mostly or primarily VOD content.
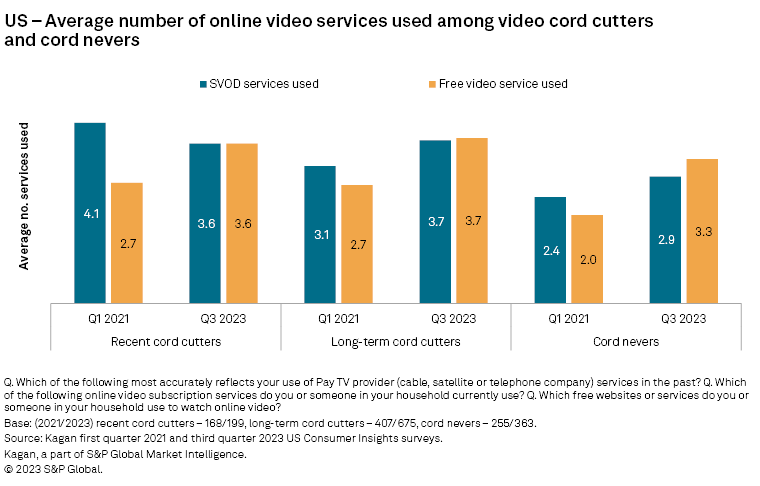
Another factor that may be contributing to increased viewing of live TV is the expanded use of free online video which includes the free ad-supported streaming TV (FAST) services, such as Pluto TV. In 2023, recent cord cutters used an average of 3.6 free online video services compared to 2.7 in 2021. Almost identical results were found among long-term cord cutters. Cord never households also exhibited a similar shift with the average number of free online video services used increasing from 2.0 in 2021 to 3.3 in 2023.
In contrast, the use of SVOD services among recent video cord cutters dropped slightly from an average of 4.1 services, in 2021 to 3.6 services in 2023. However, this level of SVOD use is still higher than it has been historically among video cord cutters, as evidenced by SVOD use among long-term cord cutters increasing from 2.7 service on average in 2021 to 3.7 services in 2023. Among cord nevers, the average number of SVOD services used has also increased modestly over the past three years.
The Kagan 2017-2023 US Consumer Insights surveys were conducted during the first quarter and third quarter of each year. Each of the surveys consisted of approximately 2,500 internet adults. The surveys have a margin of error of +/-3 ppts at the 95% confidence level. Percentages are rounded to the nearest whole number. Survey data should only be used to identify general market characteristics and directional trends.
To submit direct feedback/suggestions on the questions presented here, please use the “feedback” button located above, directly under the title of this article. Note that while all submissions will be reviewed and every attempt will be made to provide pertinent data, Kagan is unable to guarantee inclusion of specific questions in future surveys.
Consumer Insights is a regular feature from Kagan, a group within S&P Global Market Intelligence's TMT offering, providing exclusive research and commentary.
This article was published by S&P Global Market Intelligence and not by S&P Global Ratings, which is a separately managed division of S&P Global.
