


?$responsive$)


Research — 15 May, 2024
Interconnection queues show swelling volume but FERC reforms slowly taking hold
By Adam Wilson and Tony Lenoir
The US had more than 2.2 TW of interconnection queue capacity seeking to connect to the grid as of April 2024 — approximately 1.7 times the size of the country's current grid-scale generation fleet. Renewables, now aided by the long-term tax credits of the Inflation Reduction Act of 2022, account for more than 94% of the total, with increasingly popular hybrid systems markedly on the rise since our 2023 analysis.
Combined with still lengthy average wait times — essentially in line with our June 2023 findings — the sheer amount of proposed capacity continues to conjure up images of an unwieldy, somewhat inflexible process impeding decarbonization of the power sector. Drilling into the data, however, shows dwindling backlogs across four regions and a marked upswing in the proportion of active queue capacity with an interconnection agreement, suggesting reforms from the Federal Energy Regulatory Commission's July 2023 Order No. 2023 to help unclog interconnection queues are beginning to have an effect.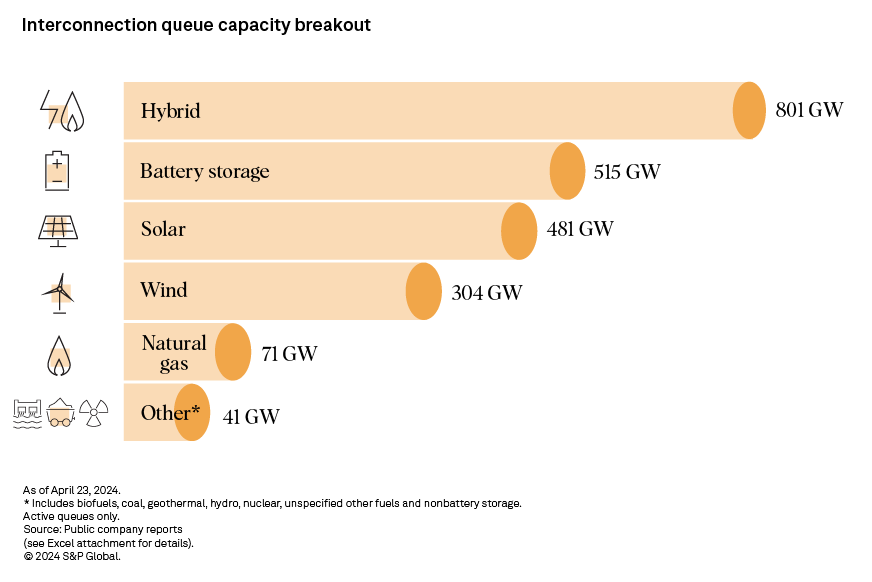

– Renewables account for at least 92% of interconnection queue capacity in eight of the nine regions designated in this analysis. The non-ISO Southeast, where renewables make up 62.4% of queue capacity, is the lone exception.
– Hybrid capacity leads all technology categories in interconnection queue capacity surpassing 800 GW, with most of this capacity involving solar and battery storage.
– California (410 GW) and Texas (326 GW) rank first and second, respectively, in combined interconnection queue capacity. Oregon, Arizona, New York and Illinois are also in the triple digits of planned capacity in GW.
– Interconnection queue capacity declined since June 2023 for California ISO, Midcontinent ISO, PJM Interconnection LLC and Southwest Power Pool as grid operators prioritize working through existing project backlogs over integrating new projects to the queue.
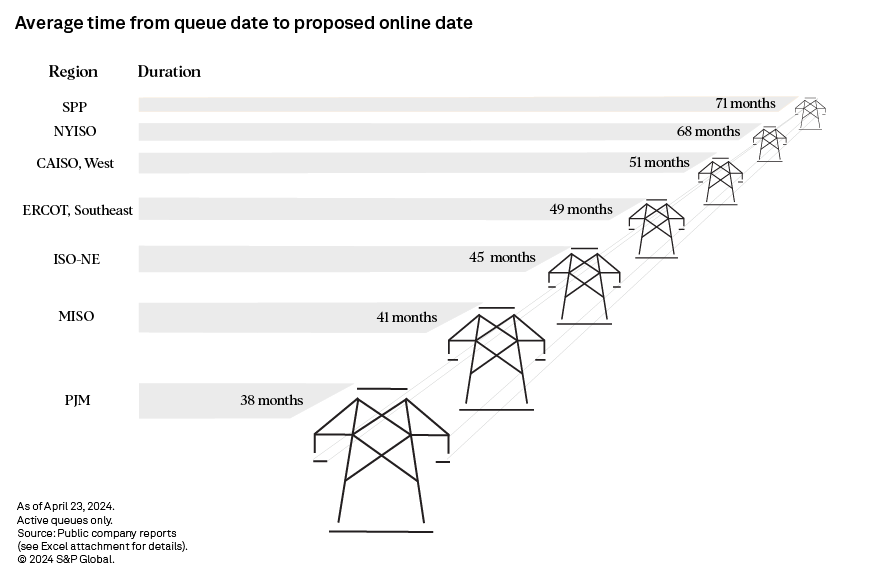
– The average wait time between projects entering the queue and reaching commissioning increased slightly in five regions. Six regions — SPP, New York ISO, non-ISO West, CAISO, Electric Reliability Council of Texas Inc. and the non-ISO Southeast — now average at least four years between queue entrance and the proposed start of commercial operations.
– Projects with a signed interconnection agreement made up almost 16% of interconnection queue capacity in this update. This is up from just 9.1% in June 2023, further supporting the push to advance legacy projects to unclog interconnection queues.

For this analysis, S&P Global Commodity Insights compiled and harmonized the active interconnection queues of all seven US ISOs and 19 major utilities across the US Southeast and the West — geographies not managed by ISOs — as of the start of April 2024. Harmonization included fuel type classification, regional grouping, utility ultimate parent identification and standardization, and proposed location fine-tuning.
"Interconnection queues" are made up of power projects requesting connection to the grid. Once in the queue, the proposed facilities go through a series of studies to assess their impact on the grid. This includes potential transmission upgrades or expansions needed to accommodate the proposed capacity. The process culminates in the extension of an interconnection agreement — a necessary contract for projects to begin construction.
Data visualization by Shirley Gil.
For wholesale prices and supply and demand projections, see the S&P Global Market Intelligence Power Forecast.
Regulatory Research Associates is a group within S&P Global Commodity Insights.
S&P Global Commodity Insights produces content for distribution on S&P Capital IQ Pro.
This article was published by S&P Global Market Intelligence and not by S&P Global Ratings, which is a separately managed division of S&P Global.