


Research — 15 May, 2024
Insurance Investments Market Report: Insurers take long view of the short game

By Tim Zawacki
A rising tide lifted all boats in 2023 as a higher-for-longer interest rate environment drove substantial growth in net investment income for US property and casualty and life insurers. Despite an uncertain outlook for Federal Reserve interest rate policy, economic growth and geopolitical tensions in 2024, insurers' investment portfolios stand to benefit for the foreseeable future from materially higher new-money yields.

The newly released S&P Global Market Intelligence 2024 US Insurance Investments Market Report details the meaningful progress insurers have made in boosting yields on invested assets off of historical lows. But the improvements have been uneven and, in the case of the P&C industry, they have been partially masked by the effects of a series of extraordinary transactions involving a single group of companies. The report also makes the following findings:
➤ Many insurers pursued attractive yields on high-quality, shorter-duration investments such as US Treasuries while select others took the opportunity afforded by rising longer-term rates to extend duration. The report finds that the maturity profile of industry investments as of Dec. 31, 2023, showed relative increases on a year-over-year basis at both the short and long ends of the curve.
➤ Alternative investment strategies, particularly holdings of private credit, privately placed debt securities private equity, and mortgage loans, continued to increase in popularity, reflecting issuance trends, the increased emphasis on the insurance sector by a wide range of third-party alternative asset managers, and a continued willingness among insurers to trade incremental liquidity for incremental yield. At the same time insurers continued to diversify into some of these less-liquid investments, their portfolios moved upward in credit quality, in part reflecting the emphasis on short-term positions in US government securities.
➤ Macroeconomic factors will weigh heavily on how investment portfolios perform and where insurers opt to focus their investing activities through the balance of 2024 including decisions about whether, where and when to extend duration. With yields on the 2-year Treasury having hit a 2024 high of 5.05% on April 30, there appears to have been little impetus for a broad-based change in approach.


|
– Access the 2024 US Insurance Investments Market Report. |
Happy days are here again
Net investment income earned in the P&C and life industries rose at their fastest rates on an adjusted basis in at least the last two decades in 2023. At $225.25 billion, life industry net investment income increased by 9.6%. While P&C net investment income fell on a year-over-year basis in 2023, the comparison reflected the outsized impact of a large transaction conducted by Berkshire Hathaway Inc. in 2022. The industry's net investment income surged by 27.7% when excluding the Berkshire P&C companies.
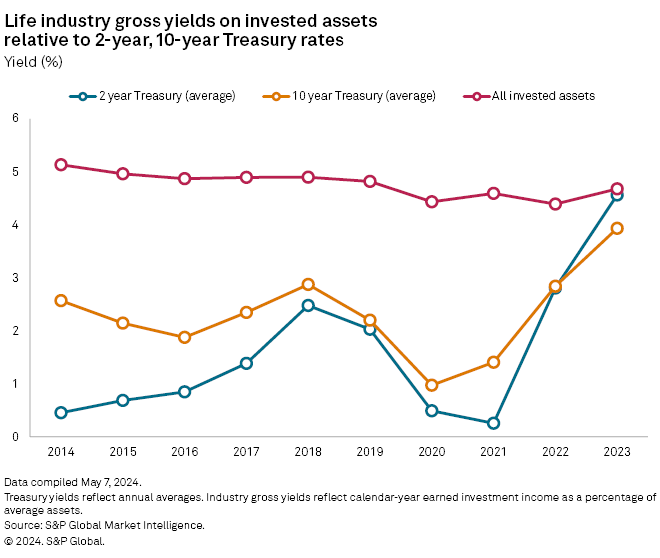
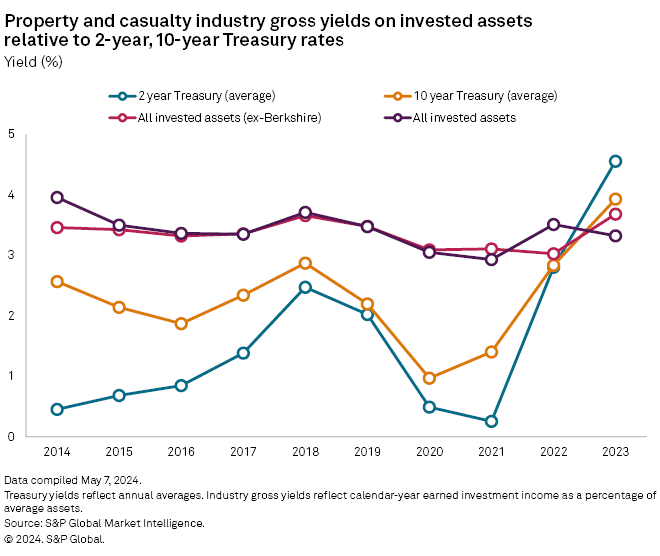
We calculate that gross yields on invested assets for life industry general accounts increased by 28 basis points from 2022's multiyear floor of 4.39% to 4.67% in 2023. For the P&C industry, excluding Berkshire, we found a 65-basis-point surge in gross yields to 3.68% from 3.03%. Many carriers obtained higher yields on newly acquired investments, offset in part by lower rates on bonds they intend to hold to maturity. This dynamic has persisted into 2024, particularly as uncertainty grew about a prospective Fed pivot to lower interest rates.
Increases in yields on bonds, which constituted 69.3% of the P&C industry's net admitted cash and invested assets and about 68.2% of life industry general accounts net admitted cash and invested assets, helped fuel the improvement. Yields on each sector's growing base of cash, cash equivalents and short-term investments also rose significantly, largely reflecting higher rates on short-term Treasuries.
Strong public equity markets and continued favorable performance of alternative investments contributed to the positive results P&C and life insurers achieved from an investment standpoint. Areas of credit weakness such as commercial real estate loans on office properties provided an offset, albeit relatively modest, in the form of higher other-than-temporary impairments and realized capital losses.
To extend or not extend?
A review of bond portfolio maturity profiles for the US P&C and life industries finds a strong push toward shorter-dated investments in 2023.
For the P&C industry, the share of bonds with a maturity of less than one year to total bonds increased by 3.1 percentage points to 17.8%, the highest level in at least the last 23 years. The increase was neither so large nor historically significant, however, when excluding the P&C subsidiaries of Berkshire. On that basis, the industry's share of bonds with the shortest maturities increased by just under 1 percentage point in 2023 to 11.3%. The disparity likely grew in the first quarter of 2024 as Berkshire reported that its position in short-term Treasuries surged to $153.44 billion as of March 31 from $129.62 billion only three months prior and just $92.77 billion at the end of 2022. The Berkshire companies accounted for 7.7% of the year-end carrying value of bonds held by the US P&C industry but 41.5% of the bonds with maturities of less than one year.
Of the 160 US P&C groups and stand-alone P&C entities with $1 billion or more in net admitted cash and invested assets as of year-end 2023, 100 increased their allocation to bonds with maturities of less than one year. For intermediate-term maturities, there was a pullback in the opposite direction with 113 of the P&C groups and stand-alone P&C entities showing declines in relative portfolio allocations to bonds maturing in five to 10 years. The industry's 26.9% allocation to bonds with that maturity profile marked a decline of nearly 1.9 percentage points year over year to its lowest point since at least the start of 2001.
The relative mix would have been even lower had the US subsidiaries of Fairfax Financial Holdings Limited not loaded up on five-to-seven-year Treasuries during the fourth quarter of 2023. S&P Global Market Intelligence data shows that bonds with maturities of between five and 10 years accounted for nearly 50.3% of the bond portfolios of Fairfax's US P&C subsidiaries, up from just 0.8% at the end of 2022, as their holdings surged to $7.77 billion from $124.2 million. A presentation given at Fairfax's annual shareholders meeting in April indicated that the company made the "timely purchase" of US Treasuries in the fourth quarter of 2023.
"For now, we've locked in good interest income, taken very little credit risk, and we haven't extended duration too far given worries about inflation," said Wade Burton, president and chief investment officer of Fairfax's investment management subsidiary, during a May 3 conference call.
There were several examples of P&C insurers going out even longer on the yield curve during 2023 as the relative allocations to bonds with maturities of 10 or more years increased for 89 of the 160 entities. Arguably most notable among them was The Allstate Corp., where its mix of bonds maturing from 10 to 20 years out rose by 5.5 percentage points to 12.0% and the share of bonds with maturities of 20 years or more increased by 4.8 percentage points to 6.7% of total bonds. Allstate reported that the duration of its fixed maturities portfolio had increased to 4.8 years as of March 31 excluding derivatives from 4.7 years as of Dec. 31, 2023, and 3.6 years at the end of 2022.
"We lowered fixed-income duration to mitigate losses as rates rose in late 2021 and held that position through most of 2022," said CFO Jesse Merten during a March investor conference. "Toward the end of '22, we began to extend duration, which combined with higher yields, has increased market-based income."
Our analysis of acquisition activity finds that corporate bonds accounted for the largest portion of bonds with maturities of between 2033 and 2042 acquired in 2023; US special revenue and agency obligations, including collateralized mortgage obligations issued by Federal National Mortgage Association and Federal Home Loan Mortgage Corp. represented the largest share of acquisitions of bonds with maturities in 2043 and beyond.
In the life sector, meanwhile, the industry's mix of general-accounts bonds with maturities of less than one year increased to its highest level since 2016 at 8.0%. The most significant upward shift occurred in bonds maturing in between one and five years, which accounted for 27.5% of total bonds as compared with less than 26.0% in 2022. Overwhelming majorities of US life groups and stand-alone life insurers with $1 billion or more in net admitted cash and invested assets increased their mix of bonds within both of these buckets.
Athene Holding Ltd. represented one exception to the broader rule as its US subsidiaries focused heavily on bonds with maturities of greater than 10 years during 2023. A review of Athene's bond holdings, limited to positions with original investment dates in 2023, finds that securities with stated maturity dates in 2048 accounted for the largest slice of the US subsidiaries' acquisitions. The purchases include investment-grade credit directly originated by Athene's parent, Apollo Global Management Inc.
Methodology
The 2024 US Insurance Investments Market Report is based on data compiled April 23, 2024, and in some cases refreshed as of May 7. Statistics on allocations by asset class and yields reflect aggregations of P&C and life general accounts annual statement line items. The discussion of related-party investments is based on a bottoms-up analysis of as-reported data on individual investments and includes a limited amount of holdings by fraternal benefit societies.
Data is limited across sectors to US-domiciled insurers that file annual statements with the NAIC. Any references to investments by life insurers at the individual or US group levels reflect legal ownership and make no assumptions or representations regarding investments associated with coinsurance with funds withheld accounts where reinsurers bear the economic risk.
All data points in this article and the full report are subject to change based on any future restatements and the receipt of new information.
For a more in-depth discussion of methodology and limitations, please see the "methodology" tab of the full report.
This article was published by S&P Global Market Intelligence and not by S&P Global Ratings, which is a separately managed division of S&P Global.