S&P Global Offerings
Featured Topics
Featured Products
Events
S&P Global Offerings
Featured Topics
Featured Products
Events
S&P Global Offerings
Featured Topics
Featured Products
Events
Banking & Capital Markets
Economy & Finance
Energy Transition & Sustainability
Technology & Innovation
Podcasts & Newsletters
Banking & Capital Markets
Economy & Finance
Energy Transition & Sustainability
Technology & Innovation
Podcasts & Newsletters
S&P Global Offerings
Featured Topics
Featured Products
Events
Research — 13 Dec, 2023

By Jason Holden
Since 2010, copper and gold head grades have dropped 7.6% and 13.4%, respectively. New high-grade operations in the Democratic Republic of the Congo (DRC) have, however, stalled this decline for copper in 2022. In the last three years, we have seen gold mined and reserve grades start to align, a signal that with a higher gold price, marginal miners have had more leeway to reduce grades while maintaining profit margins. The global tonnage of ore and waste moved continues to increase, and the stripping ratio in 2023 is set to be the highest since 2015 at 2.51-to-1.

➤ The difference between gold head grades and reserve grades has dropped from 0.24 grams per metric ton (g/t) Au in 2017 to 0.05g/t Au in 2023.
➤ New high-grade deposits ramping up have thwarted a continued fall in copper head grades after a decade of declines — copper head grades averaged 0.52% Cu in 2022.
➤ Global tonnage of ore and waste in 2023 to be the highest on record so far, with further increases projected in 2024–25.
➤ The average stripping ratio for base metal and gold mines in 2023 is set to be the highest since 2015, at 2.51-to-1.

Copper and gold head grades have fallen over the last decade. The average copper head grade in 2022 was 0.52% Cu, and the average gold grade was 1.31 g/t Au, down 7.5% and 13.4%, respectively, since 2012. The average reserve grade over the same period has a similar story. The average global copper reserve grade has dropped 9.1% from 0.54% Cu in 2012 to 0.50% Cu in 2022, while the average gold reserve grade has remained flat at 1.26 g/t Au since 2012. As shown in the chart below, gold mines have been mining at a higher grade than the reserve grade for much of the last decade, but the difference between the mined and reserve grade has started to close since 2020.

This is a sign that, since gold prices rose in 2020, marginal miners have had the allowance to take the opportunity to lower their head grade. Mining areas of the orebody with the highest-grade material is known as high grading. The mine will produce high-grade material faster and leave lower average-grade material behind. If the head grade of the mined ore is significantly higher than the reserve grade, it signals that high grading is occurring. In the past, marginal mines may have had no choice but to high grade in difficult years. Mining high-grade accessible areas of their deposits is one way for operations to bolster margins when facing low metal prices. Although there will be a short-term economic gain from this, the average reserve grade in the remaining orebody will decline. Mining costs are then impacted further into the mine life when the average grade of the ore body is reduced.
A halt in the decline in copper grades in 2022 can be attributed to the commission of some high-grade deposits. Kamoa-Kakula, a joint venture operation in the DRC with Ivanhoe Mines Ltd. and Zijin Mining Group Co. Ltd. as majority shareholders, is currently undergoing its phase 3 expansion, and head grades averaged 5.54% Cu in 2022. Miniere Musoshi Kinsenda, an underground mine also located in the DRC and operated by Jinchuan Group International Resources Co. Ltd., had a head grade of 4.25% Cu. Many of the current high-grade operations are in the Central African Copper Belt in Zambia and the DRC, which is also host to the Kolwezi, Tenke Fungurume and Kamoto operations. Outside of Africa, the Australian Cobar operation was the highest-grade copper mine in Australia at 4.05% Cu in 2022. Meanwhile, at primary gold mines, Agnico Eagle Mines Ltd.'s Macassa mine in Canada was the highest-grade gold operation in 2022 at 20.47 g/t Au, just ahead of the perennially high-grade Fosterville at 20.41 g/t Au. These two operations were far ahead of the third-ranked Costerfield mine, mining gold at a head grade of 12.21 g/t Au.
Stripping ratios and material movement continue increasing.
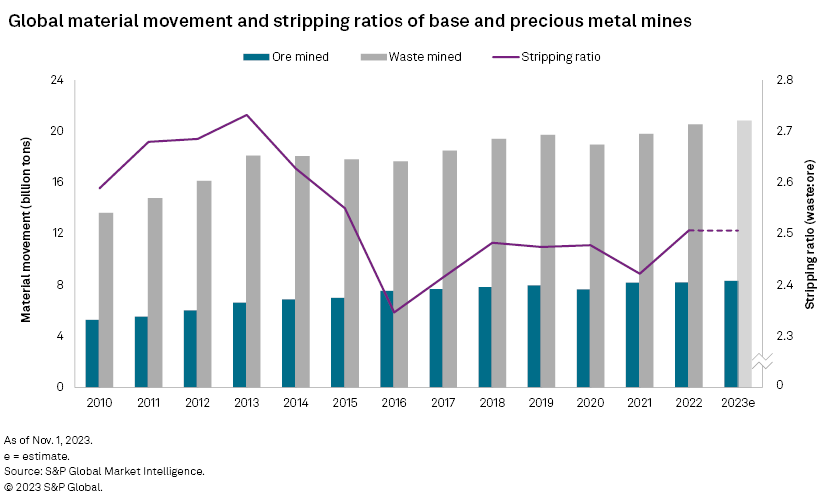
Data from the universe of 1,270 base and precious metal mines covered by S&P Global Market Intelligence shows that ore and waste mined at open pit operations reached new highs of 28.74 billion tons in 2022 and is expected to increase another 400 million metric tons (MMt) in 2023. The stripping ratio at mines has increased 6.8% since a low in 2016, reaching 2.51-to-1 in 2022.

An essential measurement in open-pit mining is the strip (or stripping) ratio, which reflects the volume of overburden, or waste, that must be moved to recover ore. To calculate the stripping ratio, the tonnage of waste material is divided by the tonnage of ore material. A key challenge for open pit operations is minimizing waste while maximizing ore extraction to keep costs low. During the economic assessment of a project, the strip ratio is used to gauge how profitable a deposit could be. The general rule is that lower costs and higher profit margins result from lower stripping ratios. Conversely, higher stripping ratios typically result in higher mining costs, potentially ruining the deposit economics.
Global tonnages of ore and waste material moved in 2023 is set to be the highest on record, with 8.20 billion tons of ore and 20.54 billion tons of waste forecast to be mined. This gives a global weighted average strip ratio of 2.51-to-1, which is still down from a high in 2013 at 2.73-to-1 but has gradually increased since 2016. Global material movement dropped 4.0% in 2020, largely due to lockdowns in response to the COVID-19 pandemic, but recovered in 2021. We estimate that global material movement will increase 1.4% year over year in 2023 and a further 2.4% in 2024. Most of this increase will be mining waste, estimated to increase 290 MMt in 2023 and 500 MMt projected in 2024, compared with estimated increases in mined ore of 120 MMt and 200 MMt over the same period.

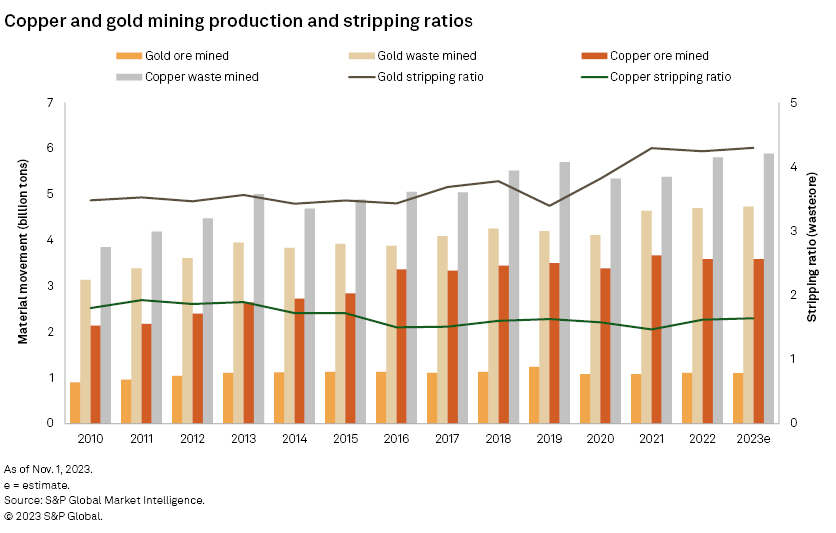
Focusing on gold, the stripping ratio of primary gold mines in 2022 was 4.24-to-1, slightly down from 4.29-to-1 in 2021, the highest recorded. Gold mines can operate with a higher stripping ratio due to the higher value of the ore. There was a sharp increase in the strip ratio between 2019 and 2021; this rise was in line with increases in the gold price, mitigating the additional cost of extracting more waste material.
Copper stripping ratios are set to increase in the coming years. In 2021, the copper stripping ratio was at a historical low of 1.47-to-1 but rebounded to 1.62-to-1 in 2022. We estimate this to continue rising over the next two years, reaching 1.65-to-1 in 2024. While copper stripping ratios are lower, copper mined tonnages are higher than those of gold. This is due to the relative grade and, therefore, value of the extracted ore. For instance, in 2022, the average gross revenue from one tonne of ore in open-pit gold mines was $55.92 compared to $38.92 from open-pit copper operations. Hence, extracting greater quantities of waste to reach gold ore was more economically viable than copper ore. As discussed in a previous article, strip ratios are strongly correlated with metal prices, and we can see the trend again in recent years, particularly in the gold sector.

While mining companies are decarbonizing their operations, a concern will be that operations will continue to have to move more ore and waste and mine lower-grade deposits to recover the same amount of metals. With the copper price forecast to remain below $9,000/t until 2026, it will be difficult for miners to manage further cost increases. With many copper miners already reluctant to push ahead with new developments, grappling with increased costs related to declining grades may further stall the development of much-needed new mines.
S&P Global Commodity Insights produces content for distribution on S&P Capital IQ Pro.
This article was published by S&P Global Market Intelligence and not by S&P Global Ratings, which is a separately managed division of S&P Global.
