S&P Global Offerings
Featured Topics
Featured Products
Events
S&P Global Offerings
Featured Topics
Featured Products
Events
S&P Global Offerings
Featured Topics
Featured Products
Events
S&P Global Offerings
Featured Topics
Featured Products
Events
Corporations
Financial Institutions
Banking & Capital Markets
Economy & Finance
Energy Transition & Sustainability
Technology & Innovation
Podcasts & Newsletters
Corporations
Financial Institutions
Banking & Capital Markets
Economy & Finance
Energy Transition & Sustainability
Technology & Innovation
Podcasts & Newsletters
13 Nov, 2017 | 10:30
Highlights
After struggling for five years with falling metal prices, copper miners have profited from this year's upswing, and we expect margins to continue trending upward.
Looking ahead to 2018, we expect only 2% of copper supply to have an all-in-sustaining cost above our forecast copper price for the year, signaling little pressure for copper miners to cut production.
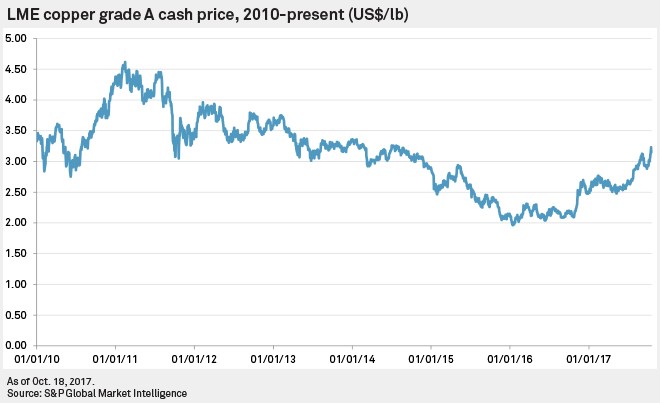
As of October 30, 2017, copper prices had increased 24% since the start of 2017 and by 58% since the lowest price seen in recent history, US$1.96/lb on January 15, 2016. Since early 2016, which marked an arrest in the copper price decline that had been evidenced since 2011, there has been less pressure to cut costs at copper mining operations. However, since early 2016, many local producer currencies have strengthened against the U.S. dollar, alongside a strengthening oil price, which has led to some upward pressure on copper mining costs.
Cash operating costs in the copper mining sector are expected to be approximately 6% higher in 2017 compared with 2016. However, the higher metal prices have provided respite to many copper miners, which had been forced to cut costs and reduce capital expenditures in the wake of falling copper prices since the highs seen in 2011.
Looking ahead to 2018, S&P Global Market Intelligence expects only 2% of copper supply to have an all-in-sustaining cost above our forecast copper price for the year, signaling little pressure for copper miners to cut production.
We expect profit margins to end this year significantly higher than in 2016, and we expect that those margins will be preserved into 2018 and 2019.
Using S&P Global Market Intelligence's Mine Economics flexing model and a consensus of broker macroeconomic forecasts for 2018, we looked at the forecast copper cost curve in 2018. This analysis takes into account how changes in the macroeconomic environment would impact costs at mining operations.
A major influence on costs at most operations is the local currency exchange rates to the U.S. dollar. As mining operations produce commodities that are internationally traded on a U.S. dollar basis, we examine mining operations in two ways. First, on a local currency cost and local currency basis, and second, by translating all operations onto a U.S.-dollar basis and examining revenue and costs in U.S. dollars.
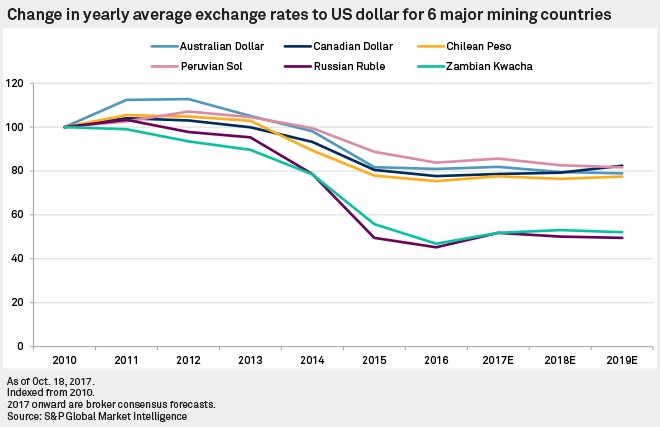
A large proportion of minesite costs will be incurred in local currency; therefore a strengthening local currency relative to the U.S. dollar will result in higher costs in terms of the U.S. currency and vice versa when local currency is weakening. Exchange rates in most major mining countries weakened from the peak of the last mining cycle in 2012, and this has helped producers cut their costs when they are expressed in U.S.-dollar terms.
Since the start of 2016, we have seen this trend reverse, with a gradual strengthening of many major mining currencies leading to upward pressure on costs. Looking ahead to 2018, the consensus is that local currency will strengthen in countries such as Canada and Zambia, while weakening in other key producers such as Australia, Chile, Peru, and Russia.
Changes in oil prices feed through to the diesel price paid by miners for use in their mining and processing equipment, and sometimes for site electricity supply from diesel generators. Diesel prices have retreated since the peak of the last mining cycle in 2012. Brent averaged over US$100/bbl from 2011 to 2014 before hitting a low of US$28.6/bbl on January 18, 2016. The drop in diesel prices led to lower fuel costs for producers after 2014.
Since the start of 2016, the trend has reversed; oil prices have been steadily increasing, with Brent reaching US$58.200/bbl on October 18, 2017. This, in turn, has led to rising fuel costs for miners. The current consensus for 2018 is that fuel prices will be sustained close to recent price levels, leading to a higher yearly average compared with 2017. As a result, we expect to see fuel costs for miners continuing to rise slightly in 2018.
The final major macroeconomic factor that could influence producer costs is inflation. We expect a steady increase in the price paid by miners for goods and services, putting upward pressure on operating costs. The greatest impact will be on labor costs, with wage rates, in local currency terms, usually increasing year-over-year in line with inflation.
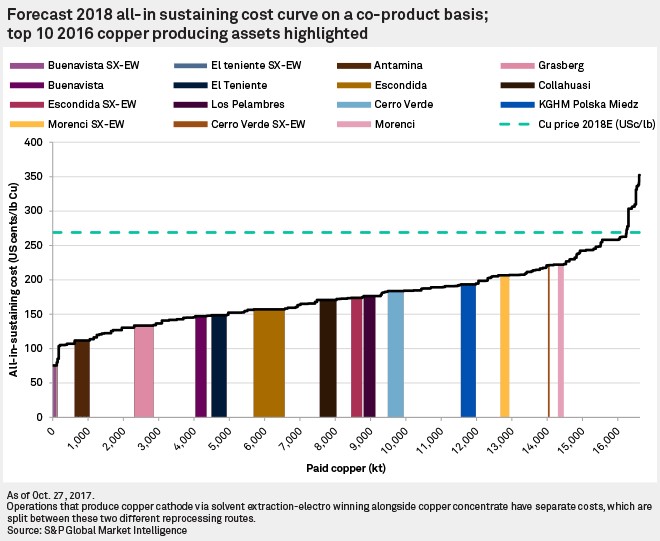
The above cost curve shows 2018 all-in sustaining costs, or AISC, on a co-product basis for our universe of copper producers, taking these macroeconomic forecasts into account alongside S&P Global Market Intelligence's copper price forecast of US$2.69/lb from October's CuCBS report. At these price levels, only 2% of the curve is breached. This would not only suggest that there is no need for miners to shutter operations, but also that there is little pressure to reduce sustaining capital costs. Indeed, alongside forecasts for even higher copper prices in subsequent years, this situation has incentivized several large copper projects to be given the go-ahead recently, such as BHP Billiton Group's Spence Growth Option and OZ Minerals Ltd.'s Carrapateena project, which were both approved for construction in August.
Highlighted on the cost curve are the top 10 copper-producing assets in 2016. The position of these assets on the cost curve shows that large mines are not necessarily low-cost operations. Although these bigger mines do benefit from economies of scale, their costs are dictated by the characteristics of the deposit being exploited alongside their geographic location.
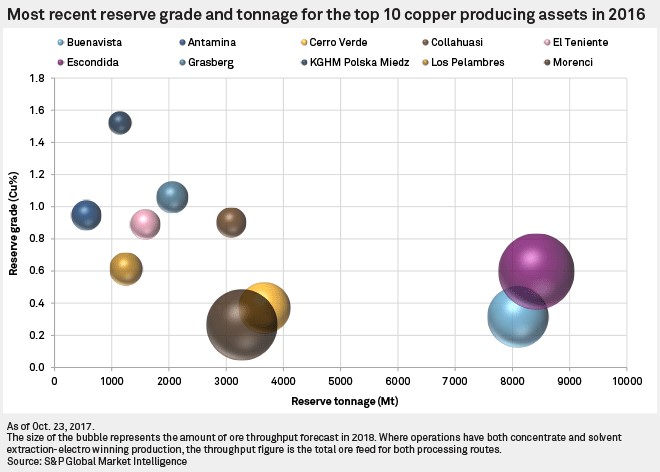
Both Morenci and its Morenci SX-EW process plant are positioned above the 75th percentile in our forecast 2018 cost curve, despite the combined Morenci operation being ranked the fourth-biggest copper mine in the world in 2016 based on copper production. The deposit has a relatively low copper grade, with the latest reserve statement for Morenci — from Freeport-McMoRan Inc., as of December 31, 2016 — outlining a grade of 0.27% copper across all ore types. This compares with a combined average reserve grade of 0.58% for the largest ten operations on the curve, measured by production volume.
Because of this low ore grade, Morenci has to mine and process more ore than operations with higher grades to get the same amount of copper. Alongside this, wages and some goods and services are more expensive at Morenci due to it being in the U.S., where wage rates are usually higher than in many other major mining countries. For 2018, we estimate that the combined labor cost, on a coproduct basis, for Morenci and Morenci SX-EW will be 42 U.S. cents/lb, which compares with an average of 24 cents/lb for the ten highlighted operations and 32 cents/lb for all copper-producing operations in the cost curve.
KGHM Polska Miedz is the other notable large, higher-cost operation in the 2018 cost curve, situated just below the 75th percentile. The situation at this operation is different to that of Morenci, with the Kupferschiefer deposit exploited by KGHM being higher grade than all the other highlighted operations. KGHM Polska Miedź SA's last published reserve data for its Polish operations, as of December 31, 2014, gave a reserve grade of 1.52% copper. However, the deposit is also relatively deep compared with other copper mines, with workings extending to a depth below 1 kilometer from the surface.
Room and pillar underground mining techniques are used to extract the ore at Kupferschiefer, which is a more selective and costly method than those used in most other copper mines. These factors combine to give a higher mining cost at KGHM Polska Miedz's Polish operations. Our estimated mining cost for KGHM Polska Miedz in 2018 is 83 cents/lb, compared with the average for all ten highlighted operations of 47 cents/lb, and 57 cents/lb for all mines in the copper cost curve.
In addition, the Polish government imposes a relatively high mineral extraction tax, which was introduced in 2012. This leads to one of the highest royalty costs, which includes production taxes, of all the copper mines in the cost curve, at 34 cents/lb, compared with an average for all operations in the cost curve of 7 cents/lb. If this royalty cost were removed from our forecast of 2018 AISC, it would result in KGHM Polska Miedz being moved below the 50th percentile in the cost curve. This highlights the importance of including royalty and production taxes when analyzing the competitive nature of mining operations.
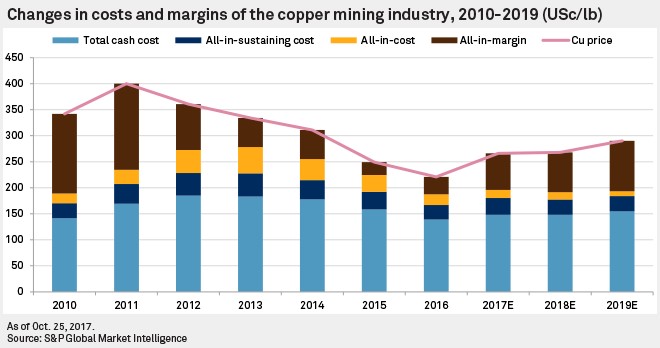
Of course, looking at costs only gives part of the picture in terms of the economic viability of an asset or industry. The above chart shows the average total cash cost (AISC), and the all-in-cost of the global copper mining industry, on a co-product basis, between 2010 and 2019.
The chart shows that margins peaked alongside copper prices in 2011. While copper prices began to decline subsequently, costs did not follow the same trend initially. All cost metrics continued to increase until 2013 as producers struggled to transition from mine plans focused primarily on maximizing production to a focus on cost efficiencies. Despite this action, margins tightened through to 2016 given the scale of price declines. This year, we have seen a weakening of the U.S. dollar against local currencies, which should feed through to a small increase in overall costs. However this has been far exceeded by the increase in the copper price, and we, therefore, expect margins in the copper mining industry to be noticeably higher this year than in 2016. Looking further ahead, we expect prices to consolidate in 2018 before tracking upward once again in 2019.
Alongside this price increase, S&P Global Market Intelligence forecasts production costs to remain effectively flat. These combined factors should lead to profit margins being maintained at similar levels in 2018 and expand slightly in 2019. We expect that margins will return to levels similar to those achieved in 2012, despite the forecast copper price being significantly lower than the average price in 2012.
Understand the economics behind mine production to make smarter, well-informed investment decisions.
