S&P Global Offerings
Featured Topics
Featured Products
Events
S&P Global Offerings
Featured Topics
Featured Products
Events
S&P Global Offerings
Featured Topics
Featured Products
Events
S&P Global Offerings
Featured Topics
Featured Products
Events
Corporations
Financial Institutions
Banking & Capital Markets
Economy & Finance
Energy Transition & Sustainability
Technology & Innovation
Podcasts & Newsletters
Corporations
Financial Institutions
Banking & Capital Markets
Economy & Finance
Energy Transition & Sustainability
Technology & Innovation
Podcasts & Newsletters
Research — 1 Aug, 2024
By Adam Wilson, Kristin Larson, PhD, Monesa Carpon, and Tony Lenoir
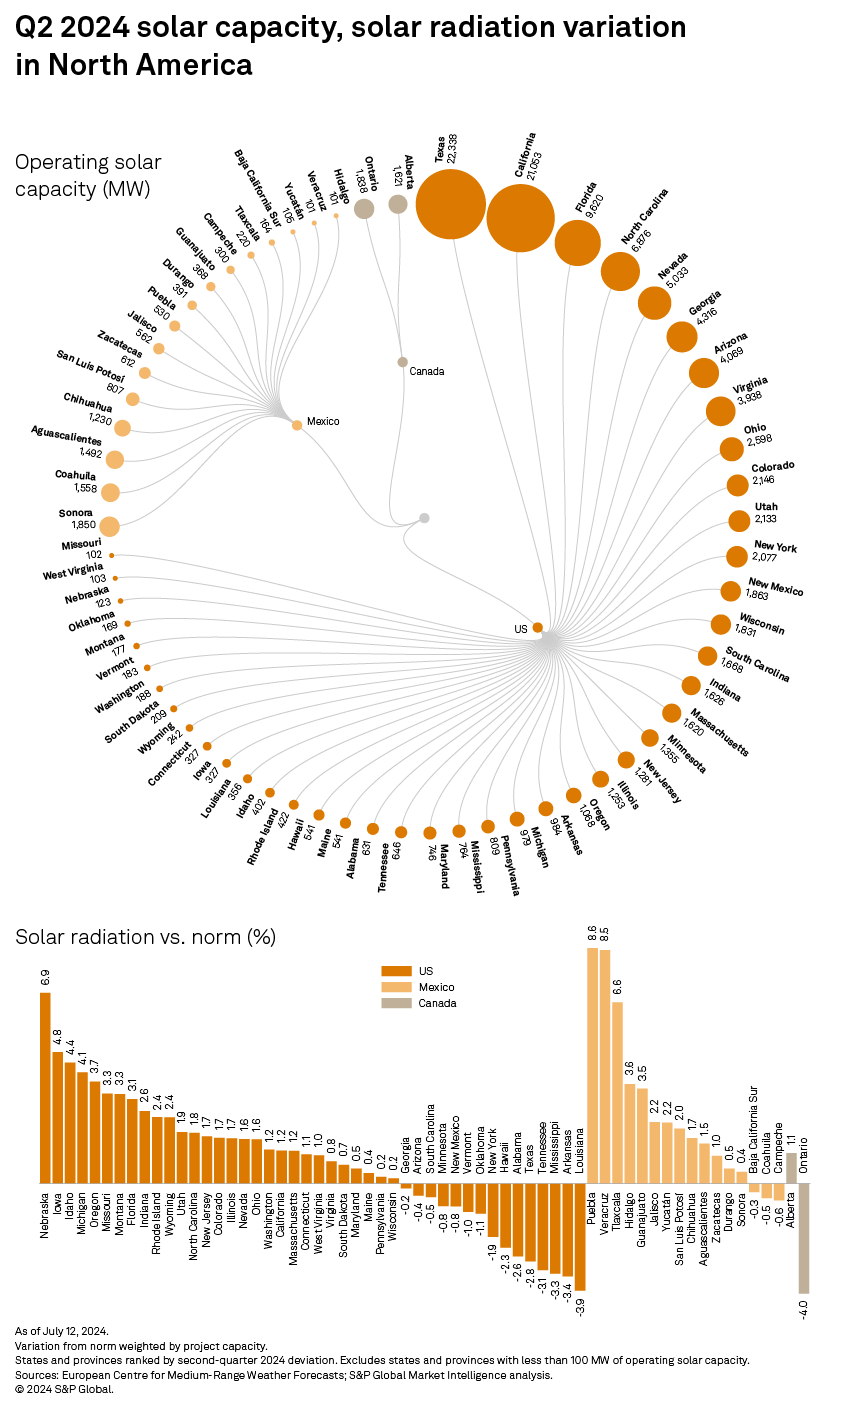
Near-normal insolation was observed across most of North America in the three months ending June 30, 2024. Positive deviations in seven of the 10 largest markets, however, kept the portfolios of most top solar owners in the black in terms of quarterly sunshine versus the 20-year average. The weighted-average solar radiation across North America was only 0.35% above normal, keeping the insolation of all 20 of the top solar owners' portfolios deviating less than 3% in either direction.

Excess solar insolation along southern Atlantic and West Coast states along with Mexico was enough to counter radiation deficits in the Southern and Northeast US, along with Ontario, across the border. Many North American territories experienced second-quarter sunshine close to the 20-year average, but overall insolation was slightly higher than normal across the continent, making the radiation deficit observed in the first quarter a temporary one.
Portfolios of seven of the top 10 — and 13 of the top 20 — North American solar capacity owners experienced insolation above the 20-year average in the second quarter. Many of these companies are also among the top wind owners in North America that experienced windier-than-normal conditions in the same period as well, boosting generation and earnings prospects for several top renewable owners.


In the US, 29 of the 44 states with at least 100 MW of operating solar took in above-average radiation in the second quarter of 2024. Florida, ranking third in operating solar capacity at 9.6 GW, notably experienced excess sunshine 3.1% higher than the 20-year average — the highest positive deviation among the 20 largest North American solar markets. Texas, on the other hand, had statewide insolation 2.8% below normal. Texas recently surpassed California to take the top spot in operating solar capacity in the continent.
Download data details in Excel.
The Canadian solar fleet is largely confined to Alberta and Ontario, which together account for 97% of the operating photovoltaic capacity in Canada included in this analysis. Ontario's 1.8 GW of solar capacity experienced second-quarter solar insolation 4.0% below the 20-year average. Alberta's 1.6 GW capacity fared better in the same period, with radiation 1.1% higher than normal.
Mexico took in sunshine 1.6% higher than the 20-year average in the second quarter. Only three states — Baja California Sur, Campeche and Coahuila — had below-normal insolation, with deviations less than 1% below average. Conversely, Puebla, Tlaxcala and Veracruz experienced exceptionally sunny conditions between April and June 2024, with positive deviations ranging from 6.6% to 8.6% above the norm. The 200-MW Central Cuyoaco and 330-MW Pachamama II solar projects, both in Puebla, were the leaders in all of North America, with solar radiation 8.6% above normal in the quarter.

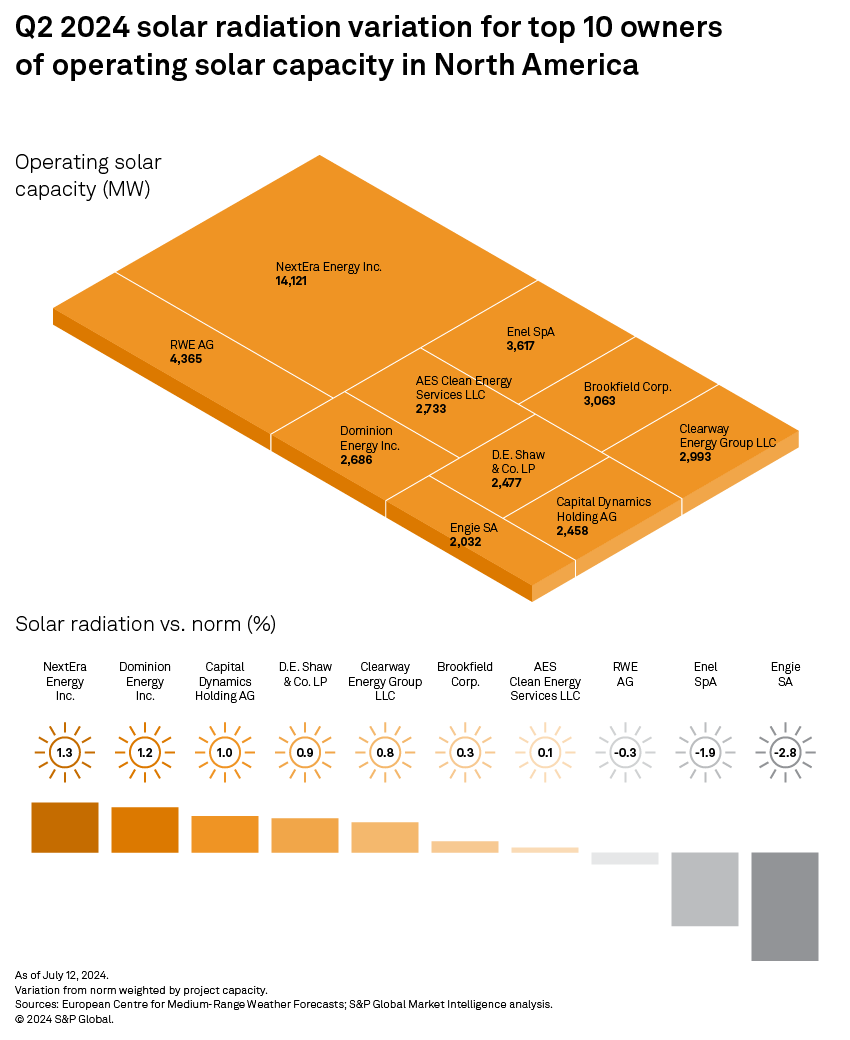
Quarterly solar deviations from the norm were largely kept in check among the top 10 owners of solar projects in North America. Six of the top 10 owners had quarterly deviations within plus or minus 1% across their portfolios. NextEra Energy Inc.'s leading 14.1 GW of operating solar capacity had radiation 1.3% higher than normal in the second quarter, the largest positive deviation among the top 10 owners in the period.
Much of the company's sizeable fleet in Florida took in excess sunshine in the quarter, which was only partially countered by below-average insolation in New York and Texas. Its 400-MW Waco Solar I Project in Texas experienced the largest radiation deficit of all its assets in the quarter, at 5.9% below normal.
Engie SA's 2.0-GW solar fleet experienced insolation 2.8% below the 20-year average — the largest negative deviation among the top 20 solar owners. Skies over the company's 342-MW Five Wells Solar Center in Texas were particularly occluded, with insolation 8.0% below normal. Exceptionally cloudy skies in April and May drove this large quarterly deviation, with monthly insolation 13% below normal for both months. Enel SpA's 3.6-GW portfolio had radiation 1.9% below normal in the quarter.

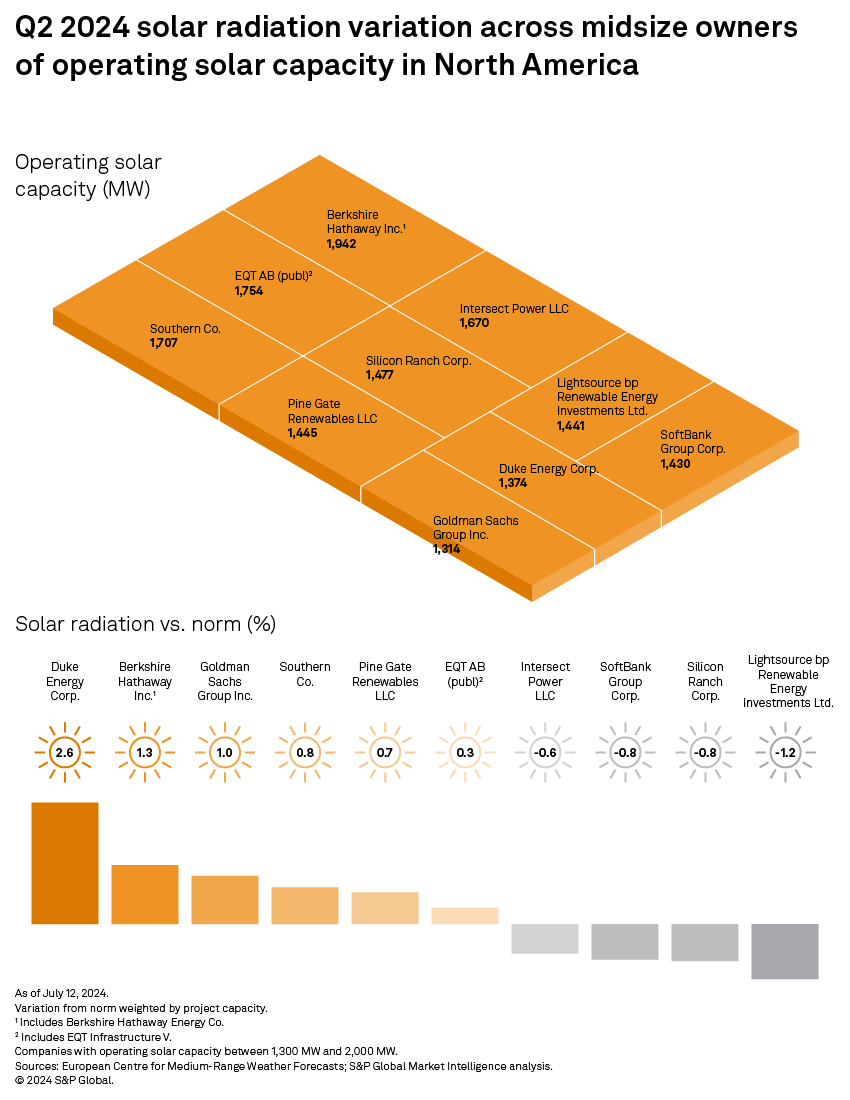
The story is similar for the midsize solar owners in North America, with most deviations in quarterly insolation within 1.0% of the average. Duke Energy Corp. led all top solar owners in above-normal radiation in the second quarter, at 2.6%. Less than 14% of the company's 1.4 GW tracked in this analysis experienced below-normal sunshine in the period. All of Duke's solar fleet in Florida, which accounts for three-quarters of the company's operating solar capacity, experienced above-average insolation in the quarter. Berkshire Hathaway Inc.'s solar fleet, totaling 1.9 GW, took in radiation 1.3% higher than the 20-year average in the period as well.
Solar radiation is the mean surface downward shortwave radiation flux measured from the fifth-generation European Centre for Medium-Range Weather Forecasts reanalysis. This variable includes direct and diffuse solar radiation and is the model equivalent of global horizontal irradiance, the value measured by a pyranometer, a solar radiation measuring instrument. The data is available at quarter-degree latitudes and longitudes, with a spacing of slightly over 27.5 km. This analysis compares second-quarter 2024 radiation values with the 20-year solar radiation average for the corresponding period.
Data visualization by Joseph Reyes.
For wholesale prices and supply and demand projections, see the S&P Global Market Intelligence Power Forecast.
Regulatory Research Associates is a group within S&P Global Commodity Insights.
S&P Global Commodity Insights produces content for distribution on S&P Capital IQ Pro.
Kristin Larson, Tony Lenoir and Monesa Carpon contributed to this article.
This article was published by S&P Global Market Intelligence and not by S&P Global Ratings, which is a separately managed division of S&P Global.