


8 Jun, 2023
180 GW of planned US renewable capacity is located in energy communities

More than a third of planned US renewable projects are sited in geographies identified as energy communities, according to an S&P Global Commodity Insights analysis, making them potentially eligible for 10% tax credit adders under the Inflation Reduction Act of 2022. With 180 GW of aggregate capacity, these projects account for 49% of US onshore wind, solar, storage, biomass and geothermal capacity currently in the pipeline.
In the Electric Reliability Council of Texas Inc. footprint, 121 GW of renewable projects are planned. Of this, 86 GW, or 71%, is in energy communities — the highest percentage of any regional transmission organization. For perspective, about a quarter of Texas counties qualify as energy communities.
Midcontinent ISO, PJM Interconnection LLC and California ISO have a combined project pipeline of 111 GW, with CAISO, at 42%, showing the highest percentage of planned renewable capacity in energy communities. MISO trails by a margin that is not negligible, at a calculated 36%. In PJM, 33% of renewable project capacity in the pipeline is situated in identified energy communities.
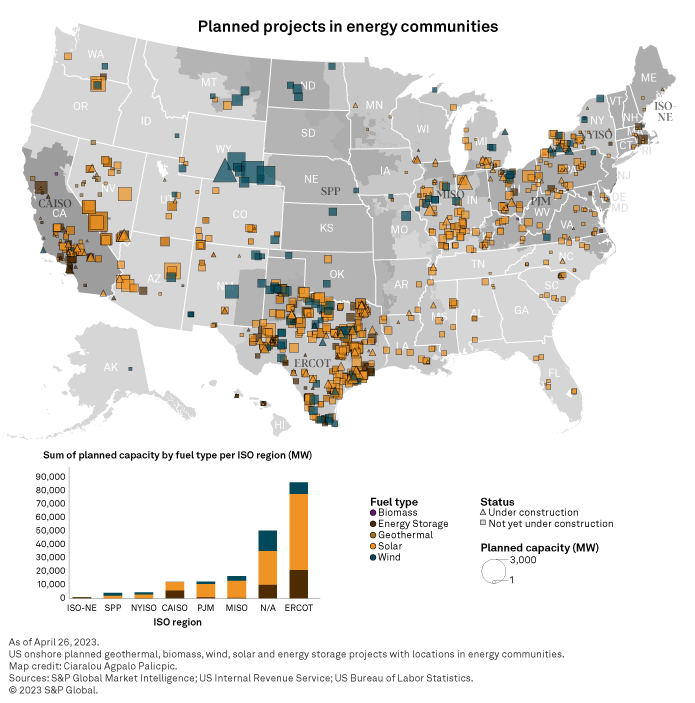
Overall, 51% of the 227-GW US solar pipeline is planned across geographies identified as qualifying under the act's energy community special rule. For battery storage, the percentage is even higher, at a calculated 55% of the 69 GW in the works. For the planned 87 GW of onshore wind capacity, the metric drops to 38%.
In Wyoming, all planned wind projects — with a total capacity of 10 GW — are in identified energy communities. This includes two 3-GW projects: Chokecherry and Sierra Madre Wind Energy Project and Pathfinder Wyoming Wind Project. With just one Wyoming solar plant not in an energy community, the pipeline percentage of renewable capacity in energy communities is 98%, the highest in any state.
Across Kentucky, Mississippi, Nevada, Pennsylvania and Texas, more than 70% of planned renewable projects are situated in energy communities, with the percentage shooting up much higher depending on renewable project types. For instance, 83% of the planned solar capacity in Kentucky shows coordinates falling within energy communities. Almost 9 GW of energy storage capacity is planned in Nevada, with 82% eligible for the 10% tax credit adder, per our analysis.
Three planned 50-MW energy storage projects in Mississippi are in energy communities: Golden Triangle II (MS Solar 6) Solar Battery Storage, Golden Triangle Solar (MS Solar 5) Battery Storage and Optimist Solar (MS Solar 7) Battery Storage. All three battery storage systems are to be colocated with solar plants.
Most of the project pipeline was developed before the Inflation Reduction Act was passed. The full effect of the 10% tax credit adder in directing development to energy communities is yet to transpire. This analysis is based on US onshore geothermal, biomass, wind, solar and energy storage projects in the pipeline as of April 26, 2023.
For wholesale prices and supply and demand projections, see the S&P Global Market Intelligence Power Forecast.
Regulatory Research Associates is a group within S&P Global Commodity Insights.
S&P Global Commodity Insights produces content for distribution on S&P Capital IQ Pro.
Ciaralou Palicpic and Tony Lenoir contributed to this article.
This article was published by S&P Global Market Intelligence and not by S&P Global Ratings, which is a separately managed division of S&P Global.