S&P Global Offerings
Featured Topics
Featured Products
Events
S&P Global Offerings
Featured Topics
Featured Products
Events
S&P Global Offerings
Featured Topics
Featured Products
Events
Banking & Capital Markets
Economy & Finance
Energy Transition & Sustainability
Technology & Innovation
Podcasts & Newsletters
Banking & Capital Markets
Economy & Finance
Energy Transition & Sustainability
Technology & Innovation
Podcasts & Newsletters
S&P Global Offerings
Featured Topics
Featured Products
Events
11 Oct, 2021

By Eric Oak
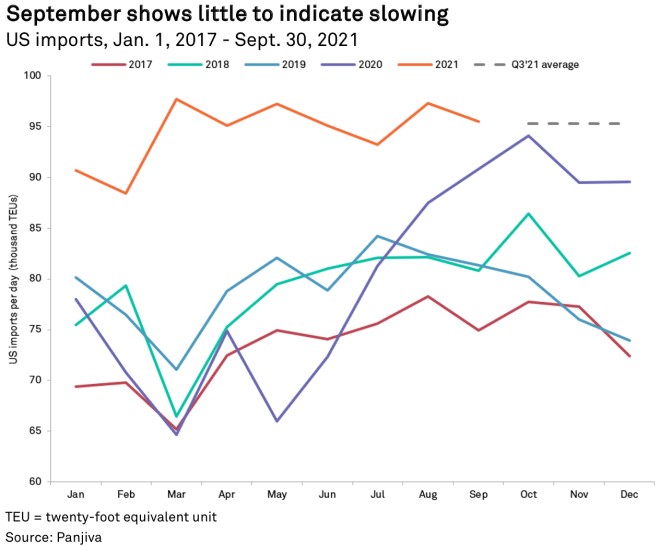
Imports to the U.S. by volume grew 5.1% year over year in September, continuing the logistics surge that has caused congestion in ports across the country. This was slower than in previous months but 17.4% higher than September 2019. The comparison with 2020 is now exceptional for a different reason — this time, it is against a post-pandemic surge rather than lockdown-related lows. September also brings the growth rate for the third quarter to 10.2% year over year, or 15.3% compared with the third quarter of 2019.
There was an average of 95,341 twenty-foot equivalent units per day in the third quarter. If imports remain at this level, the fourth quarter is expected to show a growth rate of 4.7% year over year, exceeding the record-breaking 2020 holiday season. Importers may be hoping that more surge capacity remains untapped, however, as increased imports would likely alleviate some of the pressures facing industries that rely on strong holiday sales.
China regained the top growth spot in year-over-year comparisons, up 8.3%, higher than the import growth of other Asian countries. Imports from those Asian countries, excluding China, saw their growth rate slow to 7.4% year over year in September, while the growth rate of imports from Europe slowed to 5.4%. Compared with 2019, China's import growth rate climbed 28.0%, while the same metric for other Asian countries and Europe fell to 22.5% and 14.6%, respectively. Continued congestion may be at play here, while China may be enjoying a rebound in activity from the reopening of ports like Ningbo and Yantian.

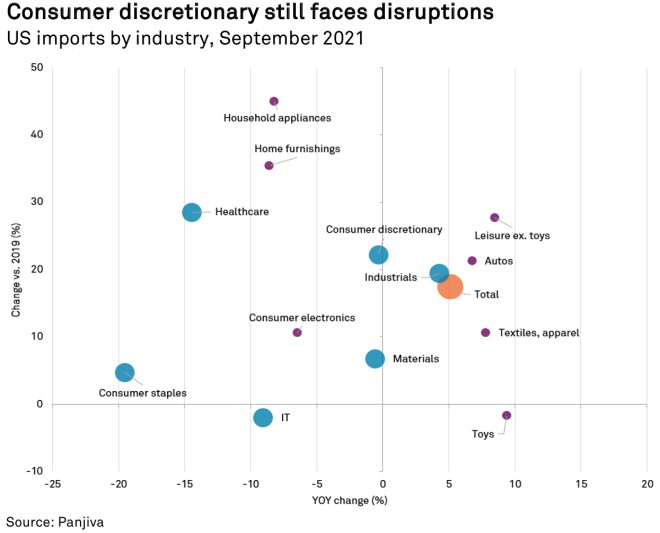
Dividing September's imports by industry shows additional trends emerging. Industrials was the only industry that grew compared with both September 2020 and September 2019, up 4.3% and 19.4%, respectively. The growth was driven by strong imports in the construction and agricultural subindustries, growing 23.8% and 43.8% year over year, respectively. Both sectors may be benefiting from strong end-user demand, with high home prices driving construction and meat disruptions showing a need for additional investment in agriculture.
The consumer discretionary industry saw related imports fall 0.3% year over year against the surge in 2020 but still increased 22.2% versus 2019. This likely reflects the congestion that importers are facing, which is stopping or slowing additional import growth at the aggregate level. The key growth drivers were the leisure (excluding toys), autos and apparel industries, all of which reported an increase compared with both 2019 (27.7%, 21.3% and 10.6%, respectively) and 2020 (8.5%, 6.8% and 7.8%, respectively).
Imports of toys climbed 9.4% year over year but fell 1.7% versus 2019. The ability to increase from 2020 but not hit the full stride of previous years may be an indication that toy supply chains are still struggling with congestion and other disruptions. Household appliances, home furnishings and consumer electronics all showed the opposite pattern, with imports down 8.2%, 8.6% and 6.5% year over year, respectively. While the logistics slowdown may have also hit these sectors, the decline may also be an effect of strong lockdown and post-lockdown demand for durables to make homes more comfortable for consumers.
Finally, the IT industry saw fewer imports in September compared with both 2019 and 2020, down 2.0% and 9.1%, respectively. Although the semiconductor subindustries reported growth — with semiconductors up 84.8% year over year and semiconductor manufacturing equipment up 64.7% — communications equipment fell 21.3% year over year, while the hardware and components categories declined 3.8% and 9.0%, respectively. The semiconductor shortage is still the likely cause of this trend, with domestic manufacturing aggressively sourcing semiconductors for high-margin products while lower-margin electronics manufactured overseas see shortages.

Eric Oak is a researcher at Panjiva, a business line of S&P Global Market Intelligence, a division of S&P Global Inc. This content does not constitute investment advice, and the views and opinions expressed in this piece are those of the author and do not necessarily represent the views of S&P Global Market Intelligence. Links are current at the time of publication. S&P Global Market Intelligence is not responsible if those links are unavailable later.
