


Blog — 4 Apr, 2023
Industry Credit Risk Trends During Economic Uncertainty: Comparing Historical vs. Forecasted Trends

This article is written and published by S&P Global Market Intelligence, a division independent from S&P Global Ratings. Lowercase nomenclature is used to differentiate S&P Global Market Intelligence credit scores from the credit ratings issued by S&P Global Ratings.
Summarizing the year behind us, we experienced some of the most extraordinary events, a full year of the Russia-Ukraine conflict, global monetary interventions to fight one of most significant inflations in recent history, and a continuing threat from global COVID containment policies that continue to disrupt supply chains today.
It goes without saying that the importance of monitoring and embedding macro-economic factors into credit risk assessments is critical.
To show how important incorporating macro-economic factors into your workflow can be, we have assessed the credit risk of 22 industry sectors (Corporates and Banks) in the United States (US) and compare historical trends based on the probability of default (PD) score generated by the RiskGauge™ Model, with forecasted trends based on this score conditioned with the macro-economic scenarios developed by S&P Global Intelligence.
For the historical analysis, we looked at the fiscal year of 2019 and 2022 (FY 2019 and FY 2022), capturing the period that included the COVID-19 pandemic, economic crisis, and other political and socio-economic disruptions. For the forecasted analysis, we leveraged the Baseline macro-economic scenario for FY 2023, which represents the most likely macro-economic trend where each variable will continue its trajectory without assumptions of additional disruptions or shocks. Under the Baseline scenario we have a very low economic growth expressed in a low Real Gross Domestic Product (RGDP) Growth, and high interest rates with still turbulent market conditions where the stock markets will have a growth deceleration respect to the last year and Crude Oil Prices fluctuating around USD 84 per barrel, as shown in Table 1.
Table 1: Baseline Scenario for FY 2023 as of Q4 2022
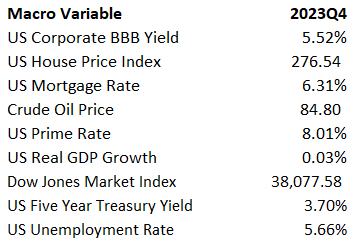
Source: S&P Global Market Intelligence, March 17, 2023.
When looking at the historical PD trends of the industry sectors in our sample we see a diverse view of the risk profile changes. Although we went through some difficult times in terms of macro-economic and social periods we observe that some of the industry sectors have had a material improvements in their risk profile. In particular, the best five improvements are in, Transportation, Chemicals, Utilities, Aerospace & Defence and Energy industry sectors between the period FY 2019 and FY 2022, as shown in Figure 1.
Figure 1: Historical Credit Risk Trends
Source: Industry Credit Risk Trend Dashboard, S&P Global Market Intelligence, as of 16th of March 2023.
Switching to a forecasted view, when applying the Baseline macro-scenario for the upcoming year FY 2023, we observed a material deterioration in the credit quality of many industry sectors in our sample, with the worst five deteriorations being in Banks, Utilities, Construction Materials, Telecoms, and Services for Businesses industry sectors, as shown in Figure 2.
Figure 2: Forecasted Credit Risk Trends
Source: Industry Credit Risk Trend Dashboard, S&P Global Market Intelligence, as of 16th of March 2023.
From the forecasted analysis we can derive that industry sectors characterized by low PD levels but sensitive to macro-economic conditions, such as Banks and Utilities, will potentially see the highest impact and deterioration in their credit quality. This material deterioration of the credit quality, particularly for Banks is driven by a combination of macro variables, such as low RGDP Growth and high interest rates, will pose a significant threat to their profitability and business stability.
When looking at the distribution of the credit risk score of the industry sectors in our sample,1 we see that a small proportion of industry sectors between FY 2019 and FY 2022 is characterized by constituents that are more investment grade than speculative grade, like Banks, Utilities, Real Estate, and Transport, while the majority of industry sectors have constituents that are more speculative grade than investment grade.2
Figure 3: Sector Industry Credit Risk Score Distribution
Due to the characteristics of the macro-economic scenario not all industries will be impacted in the same way. Our forecasts show that for the FY 2023 all industry sectors except Pharmaceuticals will migrate to worse risk profiles, as shown in Figure 4.
Figure 4: Credit Score Migration Matrix for Forecasted Observations
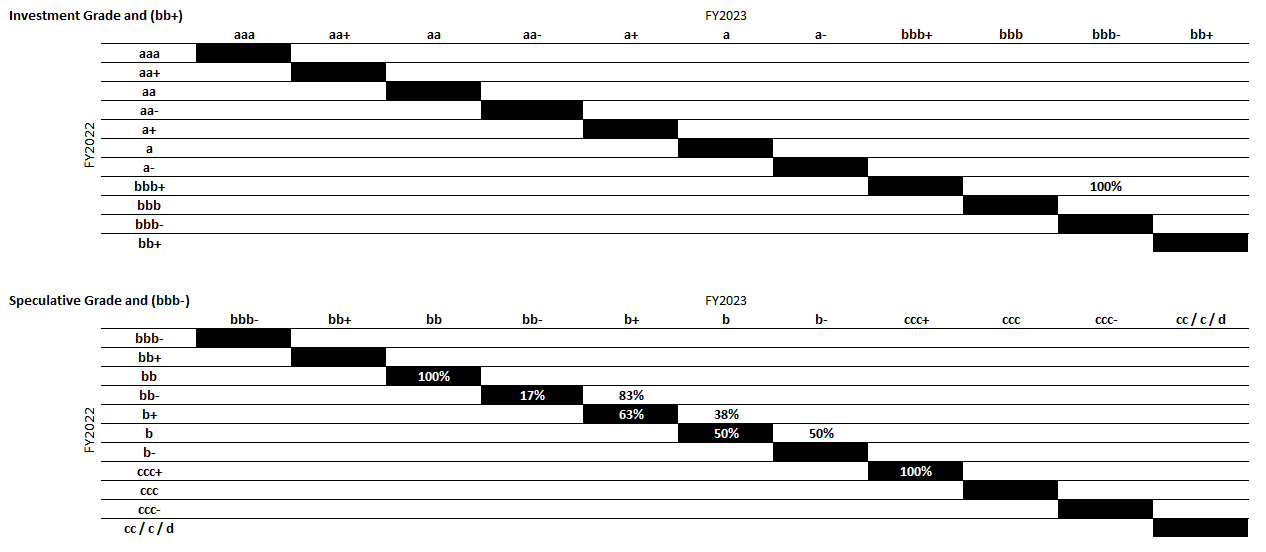
Source: Industry Credit Risk Trend Dashboard, S&P Global Market Intelligence, as of 16th of March 2023.
However, the migration for the investment grade under the forecasted scenario is more material with respect to the historical observations, in fact when we look at the historical observations between FY 2019 and FY 2022 we see a more heterogeneous migration of the credit scores as shown in Figure 5.
Figure 5: Migration Matrix for Historical Observations
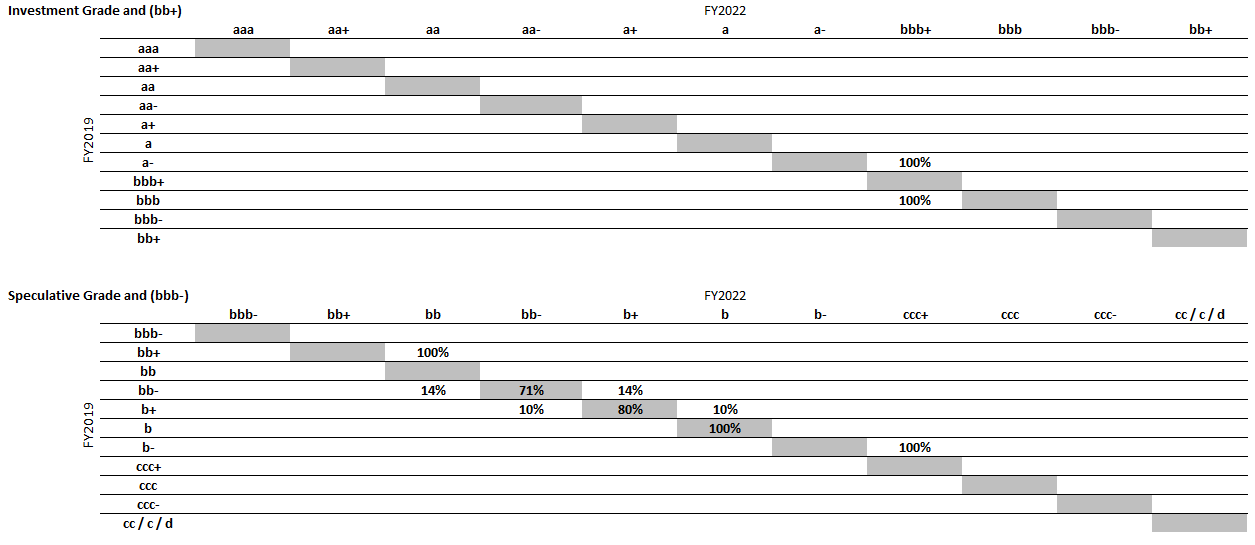
Source: Industry Credit Risk Trend Dashboard, S&P Global Market Intelligence, as of 16th of March 2023.
The analysis performed for this blog was undertaken using an interactive dashboard that enables more granular analysis across multiple scenarios, an example is shown in Figure 6. The analysis and the dashboard capabilities investigate further details on how various macro-economic scenarios for multiple years in the future might impact the credit outlook of various industry sectors but also on a more granular or sub-industry level.
Figure 6: Deep Dive in Multiple Years and Macro Scenarios
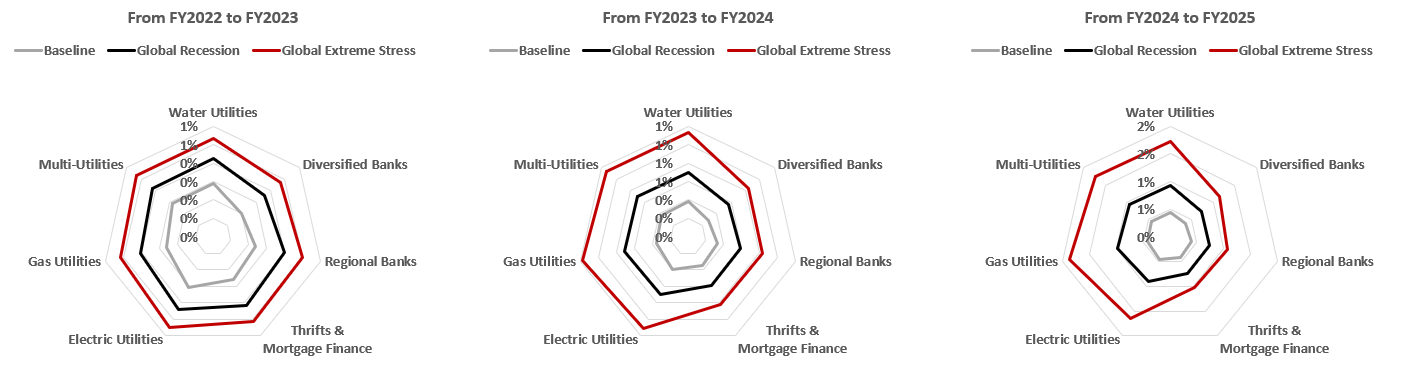
Source: Industry Credit Risk Trend Dashboard, S&P Global Market Intelligence, as of 16th of March 2023.
1 S&P Global Ratings does not contribute to or participate in the creation of credit scores generated by S&P Global Market Intelligence. Lowercase nomenclature is used to differentiate S&P Global Market Intelligence PD scores from the credit ratings used by S&P Global Ratings.
2 Industry sectors represents here the median PD level of its constituents, therefore the number of its constituents being in investment grade rather than speculative grade will determine if the industry sectors will also be in investment grade rather than vice-versa.
If you would like access to our dashboard, the detailed results from this study, or talk to one of our specialist please request a meeting here.
Products & Offerings