


Case Study — 27 Aug, 2024
A Financial Media Firm Enhances Its Platform with a Charting Solution that Brings Data to Life
Highlights
THE CLIENT: An online financial media company
USERS: Technology team
Financial media websites are bringing the latest market news and trading ideas to investors and traders who are hungry for insights that can help them get an edge and capture alpha. But competition for "eyes" is intense as users look for applications with high-quality data and visualization tools that can take their decision-making to the next level.
This financial media company currently offers comprehensive online capabilities that include news, research and actionable trading ideas. Members of the technology team wanted to upgrade the charting experience with custom features but were finding it difficult to do so with their current charting provider. Creating new charts was a laborious process, and little support was available. Additionally, the team wanted to integrate supplementary datasets into charts with event markers, but this was not possible, limiting synergies between the charts and other features of the website. An alternative provider was needed.
Pain Points
The technology team was frustrated by the limitations of the current charting solution and wanted to find:
- High-performance charting that was cost efficient and provided easy and quick implementation.
- A solution to create multiple customized charts with cross-communication between them that could also capture news events and event markers.
- A white-label solution, without any vendor logos or linkbacks to keep a user's attention on the site.
Team members knew that many of the biggest names in finance relied on ChartIQ, a data visualization tool and charting solution by S&P Global Market Intelligence ("Market Intelligence"). They reached out to the firm to learn more about the offering.
The Solution
ChartIQ specialists from Market Intelligence discussed the solution's advanced out-of-the-box functionality and how it would enable the technology team to focus their time building a unique experience. Using ChartIQ’s HTML5 toolkit, team members would be able to get high-quality charting for their users without requiring numerous dedicated resources for implementation and maintenance. By leveraging the HTML5 Charting Library, the development team would gain the ability to:
|
Offer high-quality charts |
ChartIQ lets companies provide their end users with powerful data visualization tools that facilitate the discovery of critical information. ChartIQ serves as a comprehensive infrastructure toolkit, boasting exceptional flexibility and seamless integration facilitated by a complete software development kit (SDK). The SDK comprises comprehensive APIs, ready-to-use production-grade user interface (UI) templates, sample implementations, optional add-on modules and extensive documentation. |
|
Quickly get to market |
Drop-in UI templates let clients differentiate their platforms. The UI templates make it easy to install a financial chart in a matter of hours, and light customization, such as specific brand requirements, can be accomplished with minimal effort. |
|
Provide a world-class experience |
ChartIQ's data visualization and charting brings any financial dataset to life with interactive graphic displays. There are solutions for both time series and cross-sectional data, enabling users to understand an array of related instruments using a term structure, options volatility curve or scatter plot. In addition, multiple graphics can be linked to create dynamic workflows. |
|
Work seamlessly on any platform |
ChartIQ's professional grade HTML5 Charting Library works seamlessly on any platform (i.e., mobile, web and desktop) or framework (e.g., Angular and React) using a single library. It is pure JavaScript and runs entirely within the browser. Companies often have at least one financial charting library for each platform or application they target, which means that developers have multiple code bases to maintain. With ChartIQ, users can write their code once and use it everywhere. |
|
Source data from any vendor |
ChartIQ can source data from any feed or vendor. This simplifies the data access process and brings all valuable data into one central interface and display, allowing users to compose a visual story built on multiple datasets. |
|
Join a renowned set of clients |
With security top of mind, and the technology stack to scale, ChartIQ has 350+ global clients and is on millions of screens around the world. |


Key Benefits
Members of the technology team saw that ChartIQ could provide them with advanced functionality out-of-the-box, enabling them to focus their time on their core competencies and building a unique experience on top of the Charting Library. The company lacked the personnel resources required to develop the charting in the time required, so Market Intelligence specialists developed a proof of concept to serve as a starting point for the production-level implementation. The specialists recommended a multi-chart template with additional customizations, including a pagination feature, dynamic markers to display news events and integration using the API method with the company’s in-house UI. The team agreed and can now:
- Access a more comprehensive Charting Library than what they could build in-house.
- Customize and brand the charts as needed for their use case.
- Easily overlay different datasets, like events and news, directly on a chart.
- Quickly create charts from their users' customizable watchlists.
- Benefit from advice on implementation directly from the professionals who create and maintain the product.
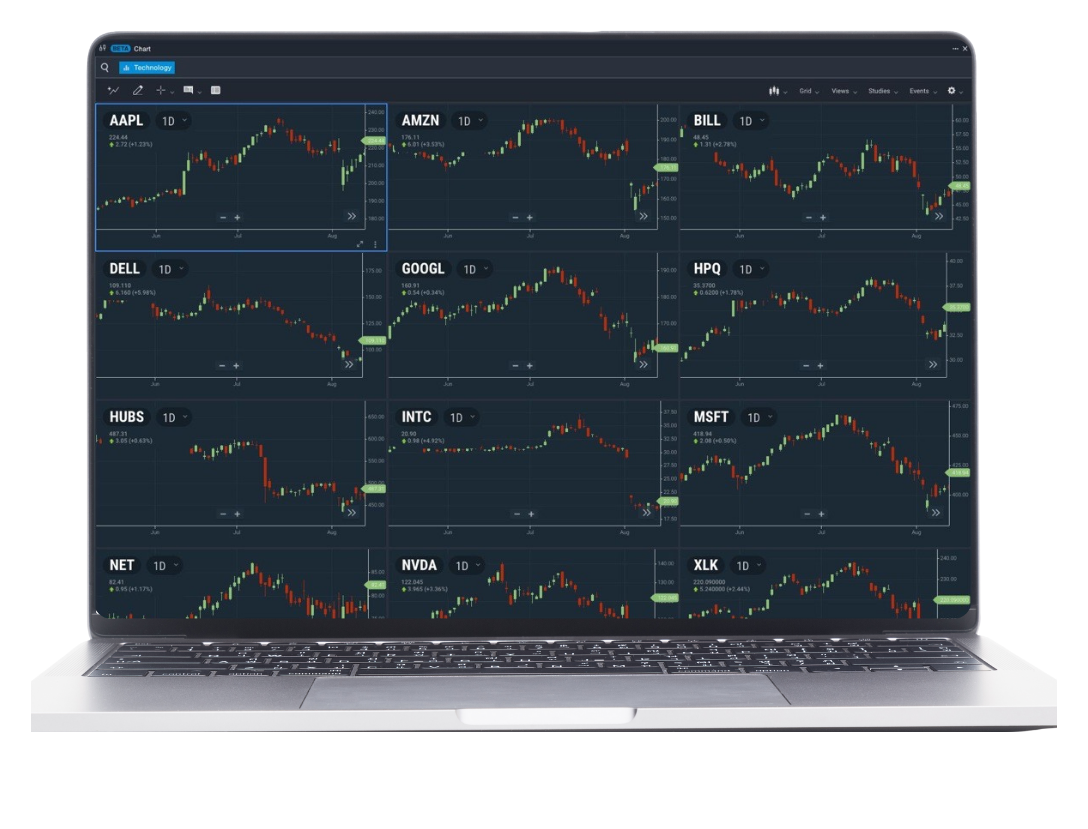
Figure 1 - ChartIQ Multichart featured on the media firm's platform.
Theme
Products & Offerings