Customer Logins
Obtain the data you need to make the most informed decisions by accessing our extensive portfolio of information, analytics, and expertise. Sign in to the product or service center of your choice.
Customer Logins
ECONOMICS COMMENTARY
Feb 18, 2021
Tracking the recovery in global trade
- Official export data combined with PMI data help to generate timely estimations of global trade growth
- Latest reading signals modest expansion in January 2021
- Going forward, forecasts can provide further insight into the global recovery from the COVID-19 pandemic
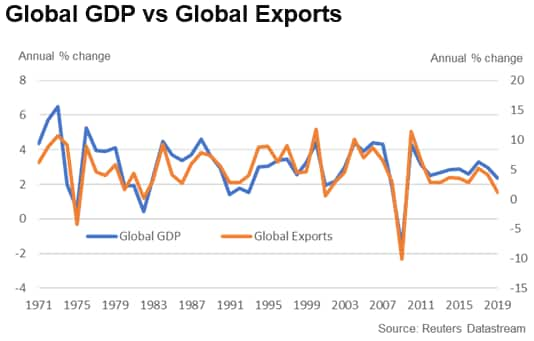
Given the integral role that trade plays in the global economy and the frequency of official trade data releases, export volume data have in recent years come to serve as an excellent barometer of global economic conditions.

However, as is the case for many economic indicators, for export data there is a notable gap between the end of a reference period and the actual release of data. Aiming to reduce that gap and provide a timelier assessment of global trade flows, we have constructed our own global trade index using a combination of official export data and IHS Markit's PMI export indices, which we can use to generate timely estimates of global trade growth.
Estimating Global Trade
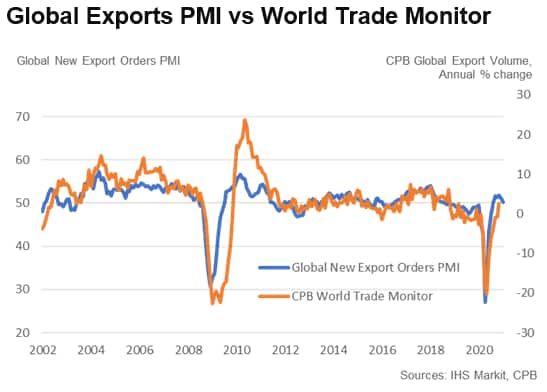
To produce this timelier estimate of global trade patterns, we have constructed an export index using official export data that a) have a limited time lag in availability and b) focus on the world's largest exporting economies. Given the importance of the biggest exporters in determining the overall trend for global trade, this approach allows us to provide an accurate estimate of exports without relying on data from some of the smaller developing countries, where releases often have the longest lags. Moreover, focusing on larger economies allows us to leverage the PMI export indices to estimate current growth rates, as they provide excellent insights into underlying global trade trends (see chart below), but crucially are available more than a month earlier than most official data sources.

Our index is built using official data for the world's 27 largest exporting nations and captures approximately 72% of global export volume.1 For index construction we use a uniform approach across all monitored countries to generate seasonally adjusted national export volume indices. Those indices are then weighted and aggregated to produce the global index.
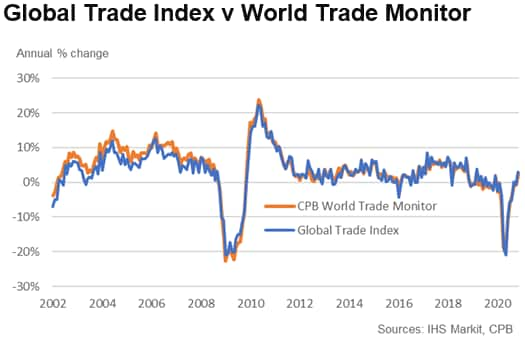
As the chart below shows, the index performs well against the widely used CPB World Trade Monitor. The CPB World Export Volume Index exhibits a correlation of 99.3% with our series, signalling an extremely high degree of co-movement.

Generating forecasts of global trade growth
With our global trade index limited to countries where high frequency data are readily available, we have a basis for generating timelier estimates of global trade flows. However, there is currently a two-month lag between the end of a reference period and the release of the estimate of global trade (using all 27 largest export nations that we track). To improve timeliness, we generate estimates for two months, one for the latest month that PMI data are available (period t) and a separate estimate for the preceding month (period t-1) where only limited official data are available.
For period t-1, we utilise official export data for the world's ten largest exporting economies (as the releases for this sub-set of countries are generally at least a month earlier than the majority of the other countries included in the wider global trade index). Taking the common factor of these ten official datasets using principal component analysis, we then use simple linear regression analysis to exploit the relationship between our derived factor and the wider global index to generate an estimate of global export volume. Based on out-of-sample testing for the three years to January 2020, we calculate that these estimates of global trade have a root mean squared error (RMSE) of around 1.3 percentage points compared to the 'final' index number based on all 27 countries of data.
In the second forecast, for period t, official trade data are even more limited, so we leverage an alternative indicator of trade flows. As mentioned previously, our own PMI export indices serve as excellent indicators of underlying export volumes in some of the world's largest exporting economies. So, this time, we take the common factor of the PMI New Export Orders indices for the ten largest exporting economies in the world and again use linear regression analysis to generate a nowcast for the latest reference period.
Note, however, there is considerably more uncertainty with this second estimate, with our analysis suggesting residuals are much higher than for the period t-1 estimations (the RMSE moves to over 2 percentage points). We therefore note that initial period t estimates should be treated with caution and interpreted as an indication of the likely trend in global trade growth.
Latest estimates
At the time of writing, the latest reading available for the global export trade index is November 2020, when global trade is estimated to have increased by 2.9% compared to the same month in 2019.
Indeed, both the CPB World Trade Monitor and our own global trade index pointed to the strongest rise in global export volumes since March 2019. The result marked a major step in the recovery towards pre-coronavirus levels of trade which, until November, had been predominantly limited to China.
Using the 't-1' methodology described above, we estimate a year-on-year contraction of -0.3% in December 2020, with a softer rise in Chinese export volumes and a sharper decline in France the notable drags.
Our forecast for January 2021 (period t) is for global export volume of somewhere around 1%-2%. The main drag on growth is expected to come from China, where January PMI data pointed to first monthly fall in exports for six months. However, this is likely to be partially offset by strong growth in the US, where the New Export Orders Index hit a 76-month high. Elsewhere, Eurozone growth remained strong, with the latest PMI export figure little-changed from December.
Looking forward, the trend in global trade will likely hinge on whether the recent slowdown in Chinese trade growth continues, and whether exports in other countries continue to expand despite ongoing coronavirus-related restrictions. An early indication of those trends can be gleaned from the next releases of manufacturing PMI data on the March 1, 2021. We will also continue to leverage and report both official trade and PMI data to provide timely estimates of global export volumes through our trade index over the coming months.
Eliot Kerr, Economist, IHS Markit
Tel: +44 (0) 203 1593 381
eliot.kerr@ihsmarkit.com
© 2021, IHS Markit Inc. All rights reserved. Reproduction in whole
or in part without permission is prohibited.
Purchasing Managers' Index™ (PMI™) data are compiled by IHS Markit for more than 40 economies worldwide. The monthly data are derived from surveys of senior executives at private sector companies, and are available only via subscription. The PMI dataset features a headline number, which indicates the overall health of an economy, and sub-indices, which provide insights into other key economic drivers such as GDP, inflation, exports, capacity utilization, employment and inventories. The PMI data are used by financial and corporate professionals to better understand where economies and markets are headed, and to uncover opportunities.
This article was published by S&P Global Market Intelligence and not by S&P Global Ratings, which is a separately managed division of S&P Global.
{"items" : [
{"name":"share","enabled":true,"desc":"<strong>Share</strong>","mobdesc":"Share","options":[ {"name":"facebook","url":"https://www.facebook.com/sharer.php?u=http%3a%2f%2fwww.spglobal.com%2fmarketintelligence%2fen%2fmi%2fresearch-analysis%2ftracking-the-recovery-in-global-trade.html","enabled":true},{"name":"twitter","url":"https://twitter.com/intent/tweet?url=http%3a%2f%2fwww.spglobal.com%2fmarketintelligence%2fen%2fmi%2fresearch-analysis%2ftracking-the-recovery-in-global-trade.html&text=Tracking+the+recovery+in+global+trade+%7c+S%26P+Global+","enabled":true},{"name":"linkedin","url":"https://www.linkedin.com/sharing/share-offsite/?url=http%3a%2f%2fwww.spglobal.com%2fmarketintelligence%2fen%2fmi%2fresearch-analysis%2ftracking-the-recovery-in-global-trade.html","enabled":true},{"name":"email","url":"?subject=Tracking the recovery in global trade | S&P Global &body=http%3a%2f%2fwww.spglobal.com%2fmarketintelligence%2fen%2fmi%2fresearch-analysis%2ftracking-the-recovery-in-global-trade.html","enabled":true},{"name":"whatsapp","url":"https://api.whatsapp.com/send?text=Tracking+the+recovery+in+global+trade+%7c+S%26P+Global+ http%3a%2f%2fwww.spglobal.com%2fmarketintelligence%2fen%2fmi%2fresearch-analysis%2ftracking-the-recovery-in-global-trade.html","enabled":true}]}, {"name":"rtt","enabled":true,"mobdesc":"Top"}
]}


