Customer Logins
Obtain the data you need to make the most informed decisions by accessing our extensive portfolio of information, analytics, and expertise. Sign in to the product or service center of your choice.
Customer Logins
EQUITIES COMMENTARY
Oct 08, 2018
Monthly model performance report – September 2018
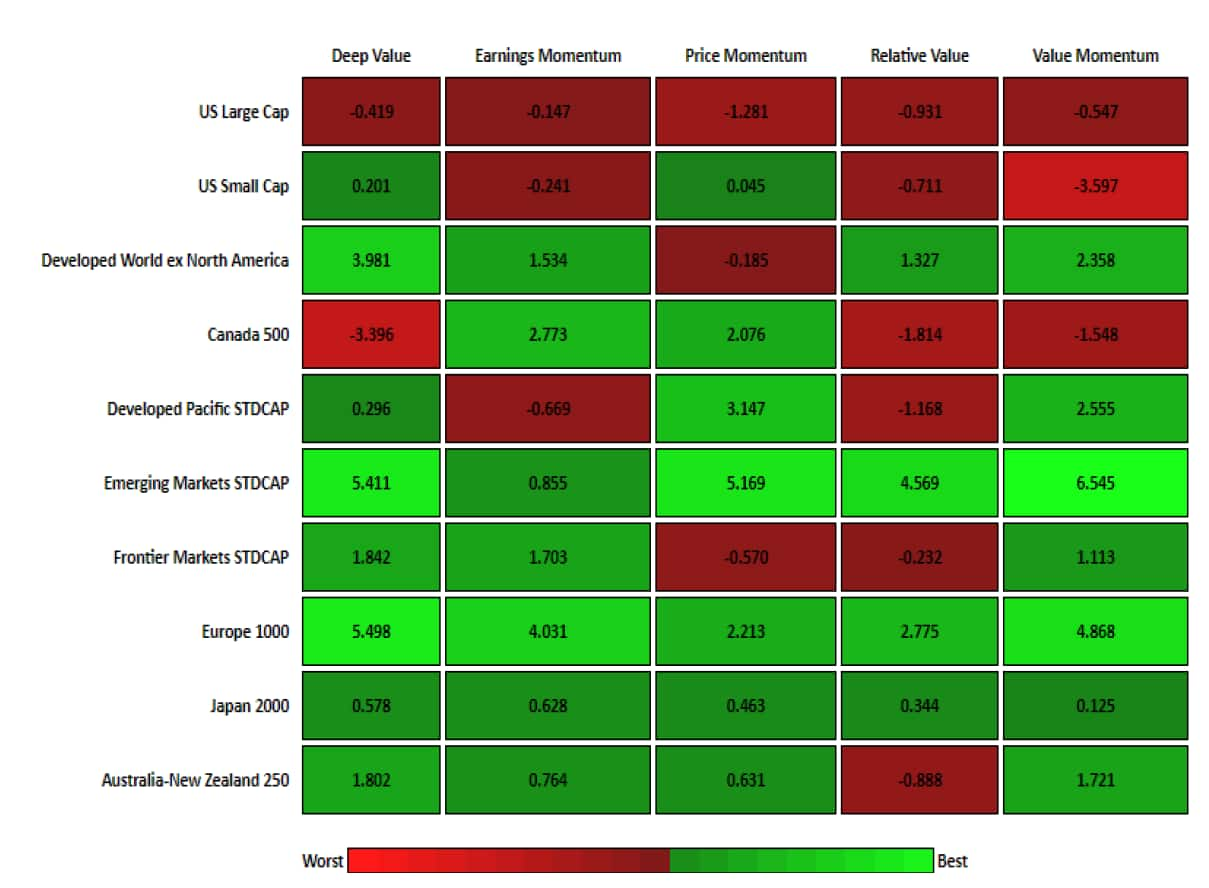
- US: Within the US Large Cap universe, the GARP model had the strongest one month decile return spread performance, returning 0.47% during the month, while the Value Momentum 2 model lagged. The performance of the GARP model was driven by the performance of the short portfolio. Over the US Small Cap universe, our Deep Value model had the strongest one month decile return spread performance, returning 0.20%, while the Value Momentum model lagged. The performance of the Deep Value model was driven by the performance of the long portfolio.
- Developed Europe: Within the Developed Europe universe, our Deep Value model was the top performer on a one month decile return spread basis, returning 5.50%, while the Price Momentum model trailed.
- Developed Pacific: Over the Developed Pacific universe, the Price Momentum and Value Momentum models had the strongest one month decile return spread performance, returning 3.15% and 2.55%, respectively, while the Relative Value model lagged. The Price Momentum model's one year cumulative performance is currently 10.87%.
- Emerging Markets: Within the Emerging Markets universe, our Value Momentum model had the strongest one month decile return spread performance, returning 6.54%. The Price Momentum model's one year cumulative performance has improved to 20.80%.
- Sector Rotation: The US Large Cap Sector Rotation model returned 0.20%.The Tech sector had a favorable ranking and the Telecom sector had an unfavorable ranking. The US Small Cap Sector Rotation model performed well returning 0.50%. The Utilities sector had a favorable ranking and the Telecom sector had an unfavorable ranking. The Developed Europe Sector Rotation model performed well returning 2.50%. The Energy sector had a favorable ranking and the Telecom sector had a unfavorable ranking.
- Specialty Models: Within our specialty model library, the Insurance and Oil and Gas models had the strongest one month quintile return spread performance returning 2.75% and 2.13%, respectively, while the REIT and the Retail models struggled.

S&P Global provides industry-leading data, software and technology platforms and managed services to tackle some of the most difficult challenges in financial markets. We help our customers better understand complicated markets, reduce risk, operate more efficiently and comply with financial regulation.
This article was published by S&P Global Market Intelligence and not by S&P Global Ratings, which is a separately managed division of S&P Global.
{"items" : [
{"name":"share","enabled":true,"desc":"<strong>Share</strong>","mobdesc":"Share","options":[ {"name":"facebook","url":"https://www.facebook.com/sharer.php?u=http%3a%2f%2fwww.spglobal.com%2fmarketintelligence%2fen%2fmi%2fresearch-analysis%2fmonthly-model-performance-report-september-2018.html","enabled":true},{"name":"twitter","url":"https://twitter.com/intent/tweet?url=http%3a%2f%2fwww.spglobal.com%2fmarketintelligence%2fen%2fmi%2fresearch-analysis%2fmonthly-model-performance-report-september-2018.html&text=Monthly+model+performance+report+%e2%80%93+September+2018+%7c+S%26P+Global+","enabled":true},{"name":"linkedin","url":"https://www.linkedin.com/sharing/share-offsite/?url=http%3a%2f%2fwww.spglobal.com%2fmarketintelligence%2fen%2fmi%2fresearch-analysis%2fmonthly-model-performance-report-september-2018.html","enabled":true},{"name":"email","url":"?subject=Monthly model performance report – September 2018 | S&P Global &body=http%3a%2f%2fwww.spglobal.com%2fmarketintelligence%2fen%2fmi%2fresearch-analysis%2fmonthly-model-performance-report-september-2018.html","enabled":true},{"name":"whatsapp","url":"https://api.whatsapp.com/send?text=Monthly+model+performance+report+%e2%80%93+September+2018+%7c+S%26P+Global+ http%3a%2f%2fwww.spglobal.com%2fmarketintelligence%2fen%2fmi%2fresearch-analysis%2fmonthly-model-performance-report-september-2018.html","enabled":true}]}, {"name":"rtt","enabled":true,"mobdesc":"Top"}
]}


