Customer Logins
Obtain the data you need to make the most informed decisions by accessing our extensive portfolio of information, analytics, and expertise. Sign in to the product or service center of your choice.
Customer Logins
BLOG
Aug 31, 2020
Daily Global Market Summary - 31 August 2020
Most global equity markets closed lower, with Japan and US tech being among the only major markets that ended the day higher. US government bonds were slightly better on the day and European bonds were lower across the region. iTraxx and CDX credit indices were close to unchanged across IG and high yield, while oil closed lower and gold higher.
Americas
- Most US equity markets closed lower except for Nasdaq +0.7%; Russell 2000 -1.0%, DJIA -0.8%, and S&P 500 -0.2%.
- A sentiment gauge, Citigroup's panic/euphoria model, which tracks metrics from options trading to short sales and newsletter bullishness, is having its longest run of extreme bullishness since the early 2000s. At around 1.1, the current reading is almost three times the level that denotes euphoria. Tesla jumped 8.5% and Apple climbed 3.6% as the two began their first day of trading at a more accessible price point [post stock splits]. (Bloomberg)
- 10yr US govt bonds closed -1bp/0.71% yield and 30yr bonds closed -2bps/1.48% yield.
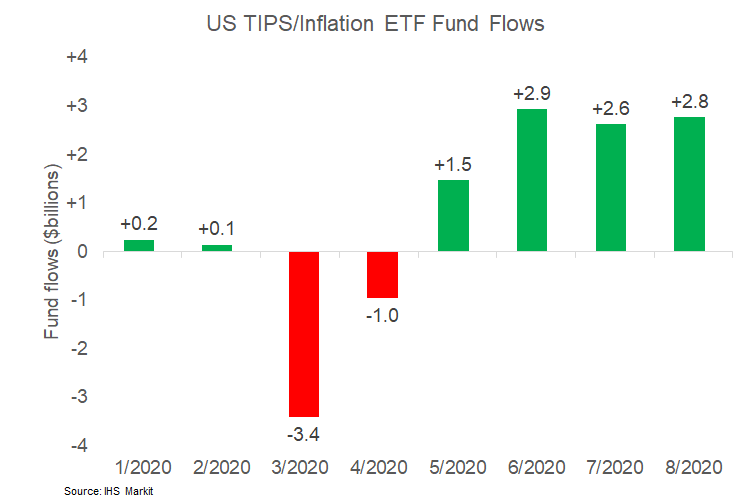
- The below chart shows 2020 YTD US TIPS/Inflation ETF fund flows
using IHS Markit's ETP data. There has been an average of $2.5
billion entering the sector's ETFs since May and the total AUM of
the group is $53.4 billion as of 28 August.
- CDX-NAIG closed -1bp/65bps and CDX-NAHY -2bps/366bps.
- Gold closed +0.2%/$1,978 per ounce.
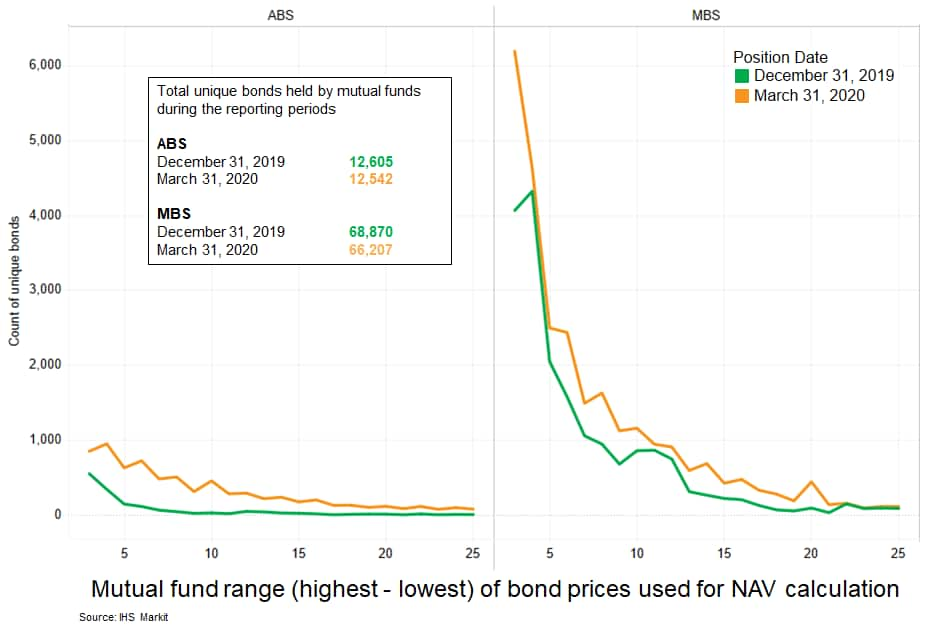
- The below chart is a follow-up to the municipal bond price
dispersion analysis published on 27 August. Similar to last week's
graph, it uses IHS Markit's mutual fund holdings database to
quantify the degree of dispersion in the prices on individual bonds
used to calculate NAVs for US funds holding ABS and MBS bonds
(note: MBS includes agency/non-agency RMBS and CMBS). The graph
shows the number of bonds that fall into each price range
(maximum-minimum price for each CUSIP).
- It is important to note that approximately 11,000 ABS bonds had a max/min price range of only 0-2 dollars on December 31, 2019 versus only 5,200 bonds on March 31, 2020 (not shown in graph due to scale).
- In the case of MBS, approximately 50,000 bonds on December 31, 2019 and 39,000 bonds on March 31, 2020 had a max/min price range of only 0-2 dollars
- The graph highlights the sharp increase in price disparity in
March due to the extreme volatility across all sectors that month,
with the data indicating over 7,000 ABS bonds and over 27,000 MBS
on the March 31, 2020 reporting date had a price difference of
three dollars or more.
- Crude oil closed -0.8%/$42.61 per barrel.
- Last week, the COVID-19 crisis receded from the spotlight as the potential fallout of Hurricane Laura threatened US Gulf Coast oil infrastructure and captivated oil markets. The storm caused significant damage, but thankfully fell short of the more severe scenarios put forth early last week as the hurricane gathered steam. As of Sunday, US Gulf of Mexico (GOM) production was down 1.3 MMb/d (70%) from pre-shutdown levels, an improvement from a deficit of 1.5-1.6 MMb/d registered over much of last week. Refining activity, which was severely impacted by precautionary shutdowns, is also beginning to recover. While worse case scenarios were largely avoided, there will still be material physical ramifications in the short term that should affect weekly statistics. Offshore production curtailments took nearly 12 MMbbl of cumulative production off the market over the past week and more than 2.3 MMb/d of refining capacity was impacted by shutdowns. On paper and in supply/demand balancing exercises, the third quarter should have ushered in the great tightening as deep OPEC+ cuts and fast-recovering demand coalesced to push the oil market into significant deficits. To be sure, draws have started to become visible in key gluts around the world, a pivot that has helped stabilize crude prices in the $40-48/bbl range. However, the physical structure of oil markets, as reflected in NYMEX WTI and ICE Brent forward curves, depicts a more fraught transition, with the contango in time-spreads for both benchmarks holding comfortably above early July lows through much of August, with WTI 6-1 spreads holding around $1.50/bbl and Brent 6-1 spreads around $2.00/bbl. (IHS Markit Energy Advisory's Roger Diwan, Karim Fawaz, Justin Jacobs, Edward Moe, and Sean Karst)
- The first estimate of US monthly job gains for August has a
dismal track record for accuracy. (IHS Markit Economist Mike
Montgomery)
- Last year it was 89,000 jobs below the third estimate, and it was 85,000 below in 2018.
- It has erred low in 17 of the past 20 years and in 23 of the past 27 years since 1992.
- Errors appear to be random before 1992.
- In the past four years of consecutive undershoots, the first estimate has been low by 63,000.
- The undercount in 2011 was by 104,000 jobs, and 2006 underestimated by 102,000 with 2007 and 2012 too low by just under 100,000 jobs low each year.
- Financial market reaction to the jobs report is always an expectations game, so does an initial underestimation of possibly 100,000 because of the "August jobs curse" matter?
- There are two other oddities which will arrive in the August jobs report--roughly 400,000 temporary Census jobs as the in-person count began late and the "non-hiring" of support persons (largely office staff, cafeteria workers, and bus drivers, etc.) in local districts starting the year off with distance education rather than on-site instruction.
- The magnitude of the Census effect is tolerably well known based on the Census track record and public statements, but local school patterns are more difficult to gauge.
- Last year the unadjusted gain in August school jobs was 337,000 positions and the September gain was 839,000 jobs. A "normally hired" person who is not hired shows up as a seasonally adjusted decline.
- If only 40% of last year's monthly gains happens this year because of distance education, local education jobs will fall by 250,000 in August and 429,000 more in September after seasonal adjustment.
- With a similar adjustment for state education jobs (mostly colleges), total government education could slide by 300,000 August jobs and 500,000 September job gains. Thus, with a "100,000 August curse" and education losses the Census bubble could be erased in the total payroll number for August.
- California recycling bills that would ban single-use packaging for many consumer products by 2032 and could be approved this week have industry groups concerned. After the COVID-19 pandemic paused the legislative session, state lawmakers are eyeing hundreds of bills before the legislature leaves town Monday (Aug. 31). AB 1080 and SB 54 are measures designed to solve the dilemma of plastic pollution in California by significantly reducing waste from single-use plastics and plastic packaging. Manufacturers would be required to make their packaging increasingly reusable, recyclable or compostable by 2032, among a host of other provisions. The legislation ended up in the inactive pile last September but was revived in August in the remaining weeks of the session. It defines "plastic" used for the "containment, protection, handling, delivery, or presentation of goods by the producer for the user or consumer, ranging from raw materials to processed goods." It also covers "priority single-use products," which are defined as "single-use food service ware made partially or entirely of plastic, including plates, bowls, cups, utensils, stirrers, and straws." And the bill includes some exemptions, such as some beverage containers and animal and human medicines. But a wide array of trade groups, including the Consumer Brands Association (CBA), National Confectioners Association (NCA), the American Bakers Association (ABA) and the California Restaurant Association, say the bill is a significant concern if it passes. "The impacts from the COVID-19 pandemic are far from over, and the current framework of these bills will have significant impacts on consumers and businesses - undoubtedly raising costs for all Californians for items we continue to rely on to protect ourselves," said a coalition of over 30 trade groups in a letter earlier this month. "For some businesses, the single-use products and single-use packaging covered by these bills are critical to their livelihood." The letter says recent amendments designed to narrow the focus to only priority single-use products made of plastics do not limit the legislation's scope to the plastic portion of a multi-material package. "In fact, any shipping container, paper, or glass container used to safely deliver products to consumers will be included if they contain any plastic components." Among the issues with the bills, the groups say, is the "extremely high" penalties of up to $50,000 per day/per violation "for a broad universe of what would qualify as a violation." (IHS Markit Food and Agricultural Policy's Joan Murphy)
- Nissan Brazil has confirmed that it will cease production of the March hatchback in the country, reports Automotive Business. Marco Silva, CEO of Nissan in Brazil, also denied any intention to divest its operations in the country and assured that the recent measures of reduction in shift, as well as the end of the March's production in Brazil, "are short-term adjustments in the face of an unprecedented situation, to adapt the plant to the demand that unfortunately it is not returning at the same speed as it fell." Silva added, "We just have to adjust the short-term issue. In the future, for sure, new investments will come. But we have to remain competitive in order to win new projects that are disputed by several other countries that have production processes as good as ours." According to a notice by the automaker, "As a natural part of the product's life cycle and for adapting its production capacity to market reality, Nissan decided to end March production at its Resende Industrial Complex. Nissan ensures that it keeps all maintenance and parts replacement services unchanged for the owners of the different versions of the model, which has had a long successful trajectory in the country." In June, Nissan announced the resumption of vehicle production this week at its Resende plant in Rio de Janeiro, involving a reduction in work shifts from two to one. The automaker also announced that it is to terminate the employment contracts of 398 employees. With the end of production of the March hatchback, Nissan now manufactures the V-Drive sedan and the Kicks sport utility vehicle in Resende. According to IHS Markit light-vehicle production data, Nissan produced 15,282 units of the March hatchback in 2019 and is forecast to produce 9,148 units until September 2020 until production stops. (IHS Markit AutoIntelligence's Tarun Thakur)
Europe/Middle East/Africa
- Most European equity markets closed lower; Spain -2.3%, France -1.1%, Italy -1.0%, and Germany -0.7%.
- 10yr European govt bonds closed lower across most of the region; Italy +5bps, Spain +3bps, and Germany +2bps.
- iTraxx-Europe closed flat/54bps and iTraxx-Xover +2bps/323bps.
- Brent crude closed -1.2%/$45.28 per barrel.
- Germany's Federal Statistical Office (FSO) has reported, based
on data from various regional states, that the country's national
consumer price index (CPI) declined by 0.1% month on month (m/m) in
August. This is 0.1% softer than the average monthly increase in
August in recent years, leading to only a slight rise of the
inflation rate from July's -0.1% to 0.0% despite supportive base
effects and modestly increasing energy prices. (IHS Markit
Economist Timo Klein)
- The EU-harmonized CPI measure posted a slightly lower -0.2% m/m, in this case dampening its y/y rate from 0.0% to -0.1%.
- The detailed breakdown of the German national data will only be published with the final numbers on 11 September, but components are available, for instance, from the largest and most populous state of North Rhine-Westphalia (NRW). This state has posted 0.0% m/m and -0.2% y/y for its headline index (the latter as in July).
- Energy prices in NRW increased by 0.3% m/m, thus curtailing their negative y/y rate from -7.1% to -5.7%. The only noteworthy monthly increase was for clothing/shoes (largely seasonal), while recreation and entertainment and alcohol/tobacco posted declining prices.
- With respect to changes in y/y rates, inflation was boosted the most by transport (from -3.4% to -2.6%) and furniture and household goods (from -1.1% to -0.7%). Most of this upward pressure was offset by lower annual inflation for food (from 0.8% to 0.4%), recreation and entertainment (from -0.3% to -0.7%, owing to cheaper package tours), alcohol/tobacco (from 3.4% to 2.7%), and "miscellaneous goods and services" (from 1.4% to 1.1%).
- NRW's core rate of inflation without food and energy declined from 0.6% to 0.4% y/y, which mainly reflects the ongoing downward tendency for recreation and entertainment and the "miscellaneous goods and services" category, but - to a lesser degree - also subdued price developments in the health sector.
- Mirroring the above, service-sector inflation in NRW softened slightly from 0.9% to 0.8% y/y, whereas goods inflation rebounded from -1.5% to -1.3%. The latter is closely linked to recovering energy prices.
- German inflation will remain close to zero during the remainder of 2020. Increasingly, however, base effects will be supportive for annual rates of inflation, and the scheduled reimposition in January 2021 of the higher value-added tax (VAT) rates that had been valid until June 2020 will lead to a jump to the 1% area at first and even near 2% in the second half of 2021.
- Notwithstanding persisting difficulties during the second
quarter in gathering the data as a result of the COVID-19-virus
outbreak, the National Institute of Statistics and Economic Studies
(Institut national de la statistique et des études économiques:
INSEE) has published a quarterly French GDP plunge of 13.8% q/q
that matches the 'flash' data released in late July. (IHS Markit
Economist Timo Klein)
- This was largely coincidental, however, as relatively large revisions to public consumption (-10.3% q/q as opposed to -8.0% q/q) and fixed investment (-14.9% q/q as opposed to -17.8% q/q) broadly offset each other and moderate upward revisions to exports (-25.0% q/q as opposed to -25.5% q/q) and imports (-16.4% q/q as opposed to -17.3% q/q) provided for the balance.
- Households' gross disposable income declined by only 2.3% q/q during the second quarter as most of the anticipated sharp fall in wages (-10.0% q/q), as well as net interest and dividends (-2.9% q/q), was offset by a strong increase in social benefits (+7.9%). This is linked to the government's various income support measures to households affected by a sudden loss of income (including short-time work subsidies) and to the automatic stabilizers in the form of reduced tax payments and social security contributions in reaction to lower gross income.
- In combination with a dip in consumer prices of -0.2% q/q, households' real purchasing power therefore fell by 2.1% during the second quarter. Given the huge 11.5% q/q decline in private consumption, households' savings rate spiked from an already record-breaking 19.7% in the first quarter (the highest in over 40 years) to 27.4%. It should be noted, however, that this does not reflect only consumers' reticence in spending, but also their inability to do so during parts of the second quarter because of administrative restrictions in the form of closed retail outlets and curfew regulations.
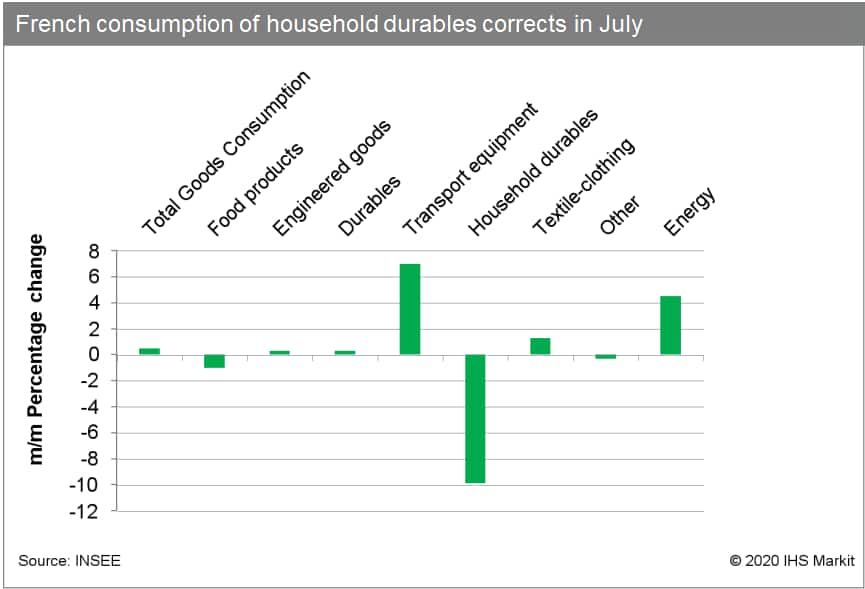
- Consumption of goods, which accounts for around one-third of total consumption and had temporarily plunged by around 30% during March to April before unwinding this drop in May to June, posted a small increase of 0.5% month on month (m/m) in July.
- INSEE has also unveiled the provisional inflation figure for
August, which suggests that inflation (measured by the
EU-harmonized index) will stand at 0.2%. This would represent an
immediate return to June's inflation rate, having briefly spiked to
0.9% in July.
- According to the detailed release, in the second quarter of
2020 the Swedish economy contracted by 8.3% quarter on quarter
(q/q) or 7.7% year on year (y/y). This is slightly better than the
flash estimate of a drop of 8.6% q/q. First-quarter GDP was revised
up marginally, from growth of 0.1% q/q to 0.2% q/q. (IHS Markit
Economist Daniel Kral)
- The detailed breakdown (see table) shows that household consumption was the main drag, dropping by 7.7% q/q. Thus, despite the absence of a formal lockdown in Sweden, households significantly changed their behavior and cut back on spending at a record pace.
- As expected, net exports were also a major drag, as exports of goods and services declined by 18.2% q/q, while imports by just 12.9% q/q. This reflects Sweden's greater exposure to cyclical industries than its Nordic peers and is in stark contrast with the first quarter, when net exports were the only growth driver.
- Fixed investment and government consumption were a drag, declining by 4.5% and 2.4% q/q, respectively. Inventories were the only sub-category contributing positively to headline growth.
- In a separate release, data from the National Institute of Economic Research (NIER) show continued improvement in the main confidence indicators in August. The economic tendency indicator improved by 3 points between July and August to 87, and manufacturing and consumer confidence by 1 point to 98 and 84, respectively.
- According to the preliminary second-quarter national accounts
results from Statistics Finland, the volume of GDP adjusted for
calendar variation contracted by 6.4% year on year (y/y; 6.3% y/y
adjusted seasonally and for calendar changes), following a downward
adjusted contraction of 1.3% y/y in the first quarter. (IHS Markit
Economist Venla Sipilä)
- Seasonally and calendar-adjusted figures show a fall of 4.5% quarter on quarter (q/q), after a slide of 1.9% q/q in the first quarter.
- As IHS Markit expected, the results mark a downward adjustment compared with the flash estimate published two weeks beforehand, which had suggested a calendar-adjusted contraction of 4.9% y/y and a seasonally adjusted fall of 3.2% q/q for the second quarter. However, for now, the Finnish economy is still outperforming the European Union on average; according to preliminary Eurostat estimates, total EU GDP in the second quarter contracted by 14.1% y/y and 11.7% q/q.
- Exports volume in the second quarter contracted by 12.0% y/y, after already falling by nearly 8% y/y in the first quarter. Service exports collapsed by 28% y/y, while goods exports retreated by 4%.
- Meanwhile, the fall in imports also intensified, reaching 12.7% y/y in April to June. Also within imports, the service category contracted faster than goods trade.
- Private consumption in the second quarter fell by 10.9% y/y, following just marginal contraction in the first quarter. Households' purchases of semi-durables decreased faster than average consumption, as did expenditure on services.
- Government consumption expenditure only decreased relatively modestly, by less than 1% y/y.
- At 1.2% y/y in the second quarter, the contraction in gross fixed capital formation remained relatively modest among key demand categories. However, this was already the fourth quarter in a row in which investments slid y/y.
- Value added in all key manufacturing categories contracted notably y/y, with the sharpest falls in the chemical, metal, and wood and paper sectors. Industrial output on the whole fell by 5.8% y/y.
- Among industrial fields, the manufacture of electronic products was the exception, managing modest growth. Meanwhile, primary production (agriculture, forestry, and fishery) on the whole grew by 2.8% y/y, driven by agricultural output gains. Construction increased by 2.0% y/y, aided by public investments.
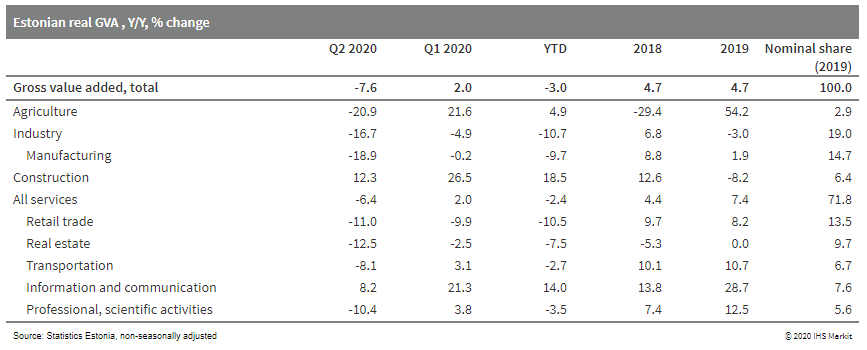
- Estonia's GDP contracted by 5.6% quarter on quarter (q/q) in
the second quarter of 2020 in seasonally and working-day-adjusted
terms. The economy in the first half of 2020 was 3.9% lower than
its level a year ago. (IHS Markit Economist Vaiva Seckute)
- The highest contribution to contraction came from investments, which plummeted by more than 15% year on year (y/y). Weak business expectations amid a struggling service sector and falling manufacturing production resulted in a sharp drop in investment by enterprises.
- Investment in building and structures contracted by 35.2% y/y and transport equipment purchases by 62.5% y/y.
- The fall could have been even larger if not softened by counter-cyclical fiscal policy and the still strong purchasing power of households.
- Government investments in buildings and structures rose by 7.7% y/y and households' investments into dwelling increased by 3.1% y/y.
- Government consumption growth also increased to 3.7% y/y. According to Statistics Estonia, this was mostly due to a 7.9% rise in healthcare spending.
- Household consumption fell by 8.7% y/y. All groups of consumption fell except for expenditure on food and communication services. A strong decline was recorded in clothing and footwear, transport, and various services.
- Exports contracted by 19% y/y and imports by 22% y/y, mostly
because of a decline in freight and transport and travel services.
As imports declined more than exports, Estonia has reached a
surplus of net exports amounting to 6.2% of GDP.
- The rural commune of Gjesdal in southwestern Norway has launched a pilot service of autonomous buses to support first and last mile transportation. The pilot scheme will run through September 11 and is part of the EU-funded FABULOS project, which aims to commercialize autonomous vehicles (AVs) in public transport networks. The city has deployed two autonomous buses, named Gudrun and Gerard, from French developer NAVYA to provide an on-demand transportation service. The buses are integrated with local public transportation network so passengers can receive information about the service through national and local travel planner apps. Fjeldsbø, mayor of the Gjesdal Municipality, said, "If successful, we would be open to making AVs a permanent part of our transport system." The FABULOS project plans to launch AV testing in five cities this year. Pilot schemes have already started in Helsinki, Tallinn, and now in Gjesdal. The remaining cities in which an AV pilot project will be launched are Lamia (Greece) and Helmond (the Netherlands). (IHS Markit Automotive Mobility's Surabhi Rajpal)
Asia-Pacific
- Most APAC equity markets closed lower except for Japan +1.1%; India -2.1%, South Korea -1.2%, Hong Kong -1.0%, and Australian/Mainland China -0.2%.
- Warren Buffett disclosed on Monday that Berkshire Hathaway Inc. made investments of 5% each in conglomerates ItochuCorp., Mitsubishi Corp., Sumitomo Corp., and Marubeni Corp. Tokyo investors and analysts described the move as classic Buffett, finding companies that trade at a discount, pay healthy dividends and might offer less risk than is commonly perceived. (WSJ)
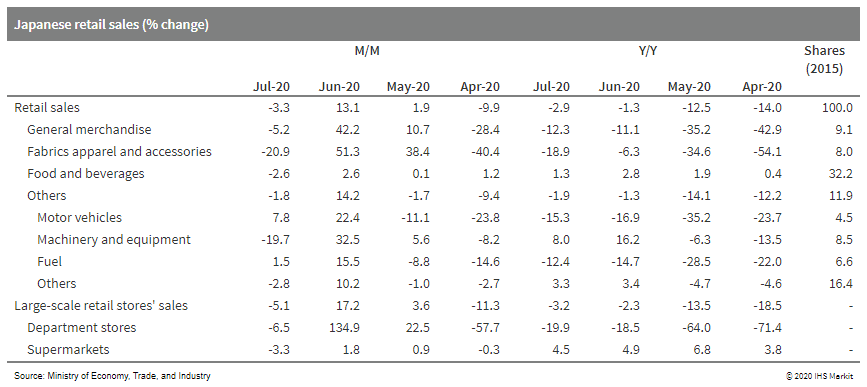
- Japan's retail sales fell by 3.3% month on month (m/m) in July,
and the year-on-year (y/y) contraction widened to -2.9%. The
weaker-than-expected figures largely reflected a pullback following
a solid rise in June, as well as a resurgence of COVID-19 cases and
the easing of the effect of one-off cash benefits. Although sales
of motor vehicles and fuel continued to rise from June, other
retail sales declined, particularly fabrics apparel and
accessories. (IHS Markit Economist Harumi Taguchi)
- Softer prices in August imply a continued weakness in consumer spending. The preliminary figures of the consumer price index (CPI) for the Tokyo ward area fell by 0.4% m/m and softened to 0.3% y/y in August.
- The weakness partially reflected weaker fresh food prices thanks to improved harvests, while the 0.7% m/m decline, or a 0.1% y/y drop, in the CPI excluding fresh food and energy reflected larger declines in accommodations, overseas package tour charges, and household durable goods.
- The July results for retail sales were weaker than IHS Markit
had expected, but the level was still 5.4% higher than the average
in the second quarter, which suggests a recovery in consumer
spending. Although new confirmed COVID-19 cases have been gradually
stabilized through August, the weak retail sales results for July
and diminishing inflationary pressures suggest that mounting
uncertainties over new COVID-19 cases could weigh down on the
recovery in consumer spending.
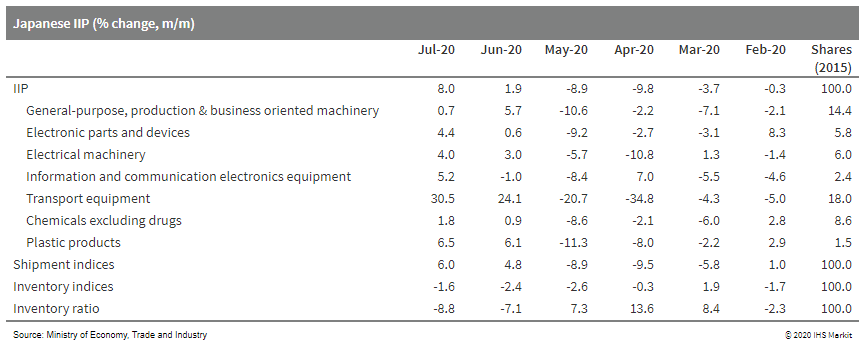
- Japan's IIP rose by 8.0% month on month (m/m) in July following
a 1.9% m/m rise in the previous month. Manufacturers' shipments
continued to rise solidly (up 6.0% m/m) while inventory fell for
the fourth month (down 1.6% m/m) and the index of inventory ratio
declined by 8.8% m/m. (IHS Markit Economist Harumi Taguchi)
- The improvement for the IIP largely reflected a broad range of industry groupings, particularly a continued solid rise of production of autos (up 38.5% m/m) and auto-related industries, thanks to the resumption of production and easing of supply chain disruption.
- Although autos and auto-related industries were the major drivers of a rise in manufacturers' shipments, stronger increases in manufacturers' shipments of iron and steel, chemical products, and electronic parts and devices signaled improved demand in a broader range of industry groupings.
- A continued decline in inventory for a range of industries was partially offset by rises in inventory of autos, electrical machinery, and information and communication electronics equipment. Although the index of inventory declined to the lowest level since September 2017, the index of inventory ratio remained 12.6% higher than the average of 2019.
- Despite a solid rebound and progress in destocking, the
relatively high inventory ratio suggests that demand remains weak,
which could lead to further destocking and weigh on production.
Industry anticipates a continued recovery of production, with
outlooks for a 4.0% m/m rise in August and a 1.9% m/m rise in
September. However, even if the actual results meet industry's
outlooks, production in September would be still below the March
level. Low capacity utilization could push out fixed
investment.
- According to figures released by the Japan Automobile
Manufacturers Association (JAMA) today (31 August), Japanese
vehicle production experienced a sharp decline of 36.6% year on
year (y/y) to 513,626 units during June mainly because the COVID-19
virus outbreak affected automakers' production operations. (IHS
Markit AutoIntelligence's Nitin Budhiraja)
- The figure includes passenger vehicles, trucks, and buses. Output in the passenger car category reached 438,986 units during the month, down by 37.0% y/y. Within the passenger car category, production of standard cars with an engine displacement of more than 2.0 liters was down by 53.4% y/y to 207,146 units during the month, while output of small vehicles was down by 17.5% y/y to 110,226 units.
- Production of mini-vehicles, categorized as vehicles equipped with engines smaller than 660cc, was up by 2.6% y/y to 121,614 units. Similar declines were recorded in the truck and bus segments, falling by 30.6% y/y to 72,291 units and by 74.6% y/y to 2,349 units, respectively.
- In January-June, Japanese vehicle production declined by 27.2% y/y to nearly 3.620 million units.
- Output in the passenger car category reached 3.094 million units during the period, down by 27.6% y/y, while truck production declined by 24.1% y/y to 486,373 units and bus output by 30.6% y/y to 39,527 units.
- By brand, Toyota continued to lead the overall vehicle output with a huge margin during June. The automaker's domestic production declined by nearly 44.8% y/y to 159,907 units, representing the ninth consecutive month of decline.
- Suzuki and Daihatsu held the second and third spots during the month with 83,173 units and 69,434 units, respectively. Output was up by 15.3% y/y for Suzuki and down by 5.5% y/y for Daihatsu.
- Honda's production volumes totaled 64,662 units, down by 17.5% y/y.
- Mazda followed with 34,181 units produced, down by 59.4% y/y.
- In the sixth spot, Subaru's output totaled 29,881 units, down by 46.3% y/y, followed by Nissan and Mitsubishi with output of 24,964 units, down by 60.8% y/y, and 24,675 units, down 54.6% y/y, respectively.
- Hino occupied the last spot with 7,190 units, a decline of 41.8% y/y.
- BYD has reported a 14.3% year-on-year (y/y) increase in net profit during the first half of 2020 at CNY1.662 billion (USD242 million), according to a company filing with the Hong Kong Stock Exchange. Revenues during the period were down by 2.0% y/y to CNY58.02 billion. The automobile segment contributed to 52% of the revenue while the handset components segment contributed 40%. Revenues decreased during the first half of 2020 owing to the decline in sales volume of new energy vehicles (NEVs) due to the coronavirus disease 2019 (COVID-19) virus outbreak. BYD's total sales during the period were down by 30.5% y/y to 158,628 units, including 60,677 NEVs, down by 58.3% y/y, and 97,951 traditionally fueled vehicles, up by 18.9% y/y. Profit attributable to owners of the company increased by 14.29% compared with the same period last year, mainly owing to enhanced overall operating efficiency and an increase in the gross profit of new products. Despite being affected by the spread of the COVID-19 virus pandemic overseas, BYD's electric buses business in overseas markets still experienced rapid growth in the first half of 2020, successfully completing the delivery of orders to Spain, Sweden, India, Japan, and other countries. Chinese regulators have confirmed that subsidies for NEVs will be extended for two more years, until 2022. Some local governments are also rolling out preferential policies with a focus on NEVs. This will better prepare the market to weather the COVID-19 virus-induced contraction in demand. (IHS Markit AutoIntelligence's Nitin Budhiraja)
- Local city regulators in China have suspended Didi Chuxing (DiDi)'s new standalone ride-hailing service, called Huaxiaozhu, reports Reuters. The city regulators of Hefei, Tianjin, Nanjing, and Qingdao have asked Huaxiaozhu to stop the service because of lack of operating licenses for the platform in their cities.This comes a month after DiDi announced the launch of a new economical ride-sharing service, Huaxiaozhu, to target younger customers. DiDi plans to roll out a new delivery and logistics services in China this year. DiDi has more than 31 million drivers registered on its platform and has attracted 550 million customers, who are using the company's range of app-based transportation options. In April, DiDi announced that it aimed to complete 100 million orders a day and to have 800 million monthly active users globally by 2022. (IHS Markit Automotive Mobility's Surabhi Rajpal)
- Baidu's subsidiary Apollo Intelligent Transportation has signed an agreement with Chinese city Guangzhou to develop an intelligent transport network in the city, reports China Daily. The company has partnered with Guangzhou-based Sci Group and Guangzhou Public Transport to develop a smart transport network, which would include the use of 5G technologies and Baidu's robotaxis and robobuses in the city's public transportation. Robin Li, chairman and CEO of Baidu, said, "At the new era of artificial intelligence, we will provide innovative technologies to work with the local government to develop autonomous driving and smart transport. To build confidence and create a future of AI, Baidu will work closely with Guangzhou to strengthen cooperation in areas of self-driving, intelligent connected vehicles and smart transportation." Guangzhou issued guidelines on autonomous vehicle (AV) road tests in December 2018. The city has opened 67 roads for AV testing, with a total length of 135 km. The city has plans to establish a national-level testing center for AVs. (IHS Markit Automotive Mobility's Surabhi Rajpal)
- India is fast becoming the world's new virus epicenter after a record jump in cases, with experts predicting it soon will pass Brazil -- and, ultimately, the U.S. -- as home to the worst outbreak globally. The number of cases stands at 3.62 million, with 64,469 deaths. (Bloomberg)
- Vietnam's exports rose by 2.5% year on year (y/y) in August,
helped by the easing of lockdown measures in key export markets
such as the United States and European Union. (IHS Markit Economist
Rajiv Biswas)
- Strong demand from the United States has helped to underpin Vietnam's resilient export sector performance in 2020 despite the severe negative impact of the COVID-19 pandemic on world trade. Vietnam's exports to the United States rose by 19% in the January - August 2020 period compared with the same period of 2019.
- Vietnam's exports during the January - August 2020 period rose by 1.6% y/y, showing a very resilient performance despite the slump in world trade during first half 2020 and the lockdowns in second quarter 2020 in many of Vietnam's largest export markets.
- Exports from Vietnamese domestic companies have performed strongly, rising by 18.3% y/y in August.
- The resilience of Vietnam's exports during 2020 year-to-date has also been reflected in expansion of the manufacturing sector, with industrial production up 2.2% y/y in the January - August 2020 period, according to estimates from Vietnam's General Statistics Office. However, for the month of August, industrial production recorded a slight decline of 0.6% y/y.
- Consumer price inflation pressures remained moderate in August, rising by 3.18% y/y, slightly below the 3.96% y/y pace recorded for the January - August 2020 period.
- As per IHS Markit's Commodities at Sea, Indonesian coal
shipments during the 29-days of August 2020 are calculated at
26.7mt (30-Day PACE of 27.6mt). In terms of Indonesian regions,
30-Day shipment PACE from East Kalimantan, South Kalimantan, and
Sumatra are calculated at 15.3mt, 7.8mt, and 2.7mt, respectively.
(IHS Markit Maritime & Trades' Rahul Kapoor and Pranay Shukla)
- In terms of yearly comparison, August 2020 shipment 30-Day PACE from East Kalimantan, South Kalimantan, and Sumatra is down by 7%, 24%, and 10%, respectively.
- In terms of destinations, the reduced August 2020 shipments are calculated majorly due to a decline in shipments to China (Mainland) and Korea (South) calculated to the tune of 38% (y-o-y) and 26%, respectively.
- Shipment PACE to India, Japan, and the Philippines increased 11%, 12%, and 27%.
- Indonesian coal production has also been negatively impacted due to weak demand.
- As per provisional data from the Directorate General of Minerals and Coal, coal production in the country in the first seven months of 2020 was announced at 321.6mt, down 9.2% y-o-y.
- Due to the challenging market conditions brought on by the
COVID-19 pandemic, major Indonesian miners have announced
production cuts at their coal mines.
- Bumi Resources which is the parent company to miners Kaltim Prima Coal (KPC) and Arutmin Indonesia lowered its 2020 output guidance to 85-90mt from the previous target of 94.5mt.
- Adaro also announced that it would be reducing its coal production target to 52-54mt. Last year, Adaro mined just over 58mt.
- Indo Tambangraya Megah (ITMG) is on track to reduce its production to 19mt-20.1mt for 2020, down 14-19% y-o-y.
- As per IHS Markit's Commodities at Sea, Indonesian coal shipments for August 2020 are calculated at 28.6mt (down 12% y-o-y).
- Indonesian coal exports for 3Q20 and 2020 are forecasted at 86.3mt (down 15% y-o-y) and 370mt (down 10% y-o-y), respectively.
S&P Global provides industry-leading data, software and technology platforms and managed services to tackle some of the most difficult challenges in financial markets. We help our customers better understand complicated markets, reduce risk, operate more efficiently and comply with financial regulation.
This article was published by S&P Global Market Intelligence and not by S&P Global Ratings, which is a separately managed division of S&P Global.
{"items" : [
{"name":"share","enabled":true,"desc":"<strong>Share</strong>","mobdesc":"Share","options":[ {"name":"facebook","url":"https://www.facebook.com/sharer.php?u=http%3a%2f%2fwww.spglobal.com%2fmarketintelligence%2fen%2fmi%2fresearch-analysis%2fdaily-global-market-summary-31-august-2020.html","enabled":true},{"name":"twitter","url":"https://twitter.com/intent/tweet?url=http%3a%2f%2fwww.spglobal.com%2fmarketintelligence%2fen%2fmi%2fresearch-analysis%2fdaily-global-market-summary-31-august-2020.html&text=Daily+Global+Market+Summary+-+31+August+2020+%7c+S%26P+Global+","enabled":true},{"name":"linkedin","url":"https://www.linkedin.com/sharing/share-offsite/?url=http%3a%2f%2fwww.spglobal.com%2fmarketintelligence%2fen%2fmi%2fresearch-analysis%2fdaily-global-market-summary-31-august-2020.html","enabled":true},{"name":"email","url":"?subject=Daily Global Market Summary - 31 August 2020 | S&P Global &body=http%3a%2f%2fwww.spglobal.com%2fmarketintelligence%2fen%2fmi%2fresearch-analysis%2fdaily-global-market-summary-31-august-2020.html","enabled":true},{"name":"whatsapp","url":"https://api.whatsapp.com/send?text=Daily+Global+Market+Summary+-+31+August+2020+%7c+S%26P+Global+ http%3a%2f%2fwww.spglobal.com%2fmarketintelligence%2fen%2fmi%2fresearch-analysis%2fdaily-global-market-summary-31-august-2020.html","enabled":true}]}, {"name":"rtt","enabled":true,"mobdesc":"Top"}
]}


