Using PMI survey data to predict official Netherlands GDP growth rates
The NEVI Netherlands PMI" has been compiled by Markit's economics team since 2000 and has built a track record of accurately anticipating official data relating to economic growth, employment and inflation. The survey-based data, derived from Markit's carefully-structured panel of 400 companies, offers investors, policymakers, business planners and other economy watchers with the most up to date guide to economic trends available.
One of the most commonly asked questions we receive is how to use the PMI to predict economic growth, to which we provide users with a simple but effective tool. More complex 'nowcasting' models can of course be developed using the PMI as one of many principal components, but few offer significantly greater accuracy than this straightforward and basic model.
In summary, a PMI of 51 indicates no change in GDP on the previous quarter, and each index point above or below 51 adds or subtracts roughly 0.1% (or, more precisely, 0.12%) from the quarterly growth rate. Those wanting more background and detail can read on....
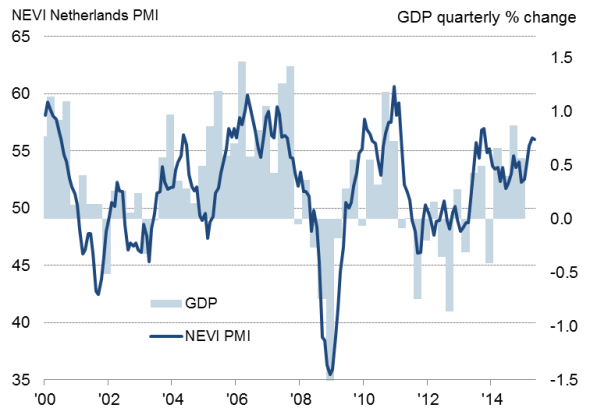
Monthly PMI data and GDP

Sources: NEVI, Markit, Ecowin.
Advance GDP estimates
In the first instance, it should be noted that the NEVI Netherlands PMI covers only the manufacturing economy. However, as in many other economies, the industrial sector tends to act as a reliable bellwether of the whole economy, meaning the PMI can be used to reliably estimate gross domestic product (GDP).
The PMI data are also available well in advance of official data, the latter being available only on a quarterly basis and published with a delay of around six weeks after the end of each quarter. Even these initial first estimates are also subject to often major revision.
Research also shows that even earlier PMI-based estimates can be derived by using the PMI data for just the first two months of each quarter, providing a reliable steer on GDP growth some 10 weeks in advance of the official data publication.
PMI-implied growth rates
Comparing the PMI against GDP shows that the highest correlation (70%) is achieved with the PMI acting as a coincident indicator of GDP (i.e. no leads or lags applied). The correlation improves to 72% if we use an average of the PMI for each calendar quarter.
However, a visual comparison suggests that since the financial crisis the PMI has trended higher than pre-recession when compared with GDP. This is not the case when the PMI is compared against manufacturing output and is likely to be because GDP also includes other sectors, notably government activity, which has dragged on GDP since the crisis. We therefore break our analysis into pre- and post-crisis.
An important next step is to derive implied GDP growth rates from the PMI - a diffusion index which varies around the neutral level of 50 (50 being the level at which the number of positive survey responses equals the number of negative responses). Simple OLS regression analysis is used whereby the quarterly rate of change of GDP is explained by the sole variable of the PMI, which is in turn calculated as a quarterly average.
This regression allows us to estimate post-crisis GDP using the following formula:
GDP quarterly % change = (PMI x 0.124) -6.305
A PMI of 51 is therefore indicative of GDP being unchanged on one quarter ago. Each index point adds or subtracts 0.12% from the quarterly growth rate.
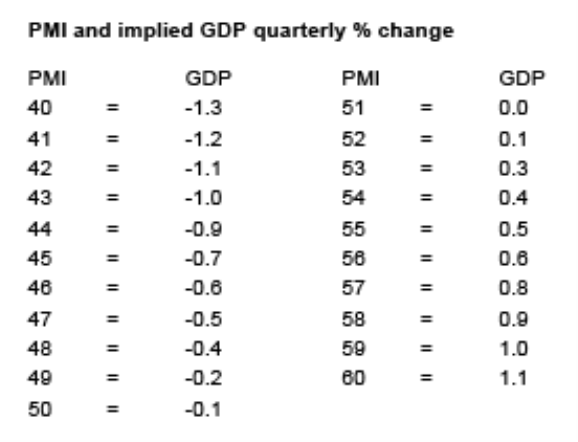
As a 'ready reckoner', the following guidance can be used:

Note that for the pre-crisis years we use the following regression:
GDP quarterly % change = (PMI x 0.0762) -3.43
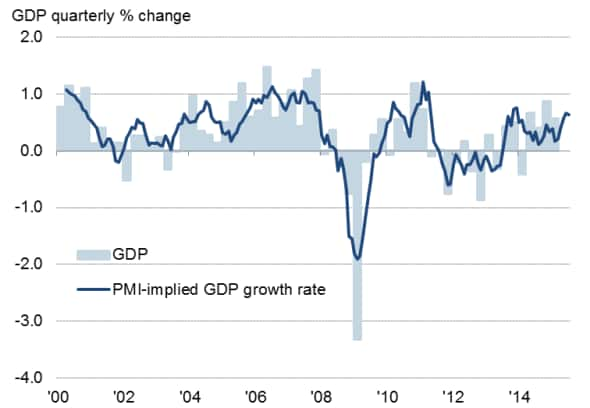
The resulting implied GDP rates signalled by the PMI and actual GDP exhibit a correlation of 78% (see chart).
Monthly PMI implied GDP growth rates

Sources: NEVI, Markit, Ecowin.
Just using the first two months PMI data
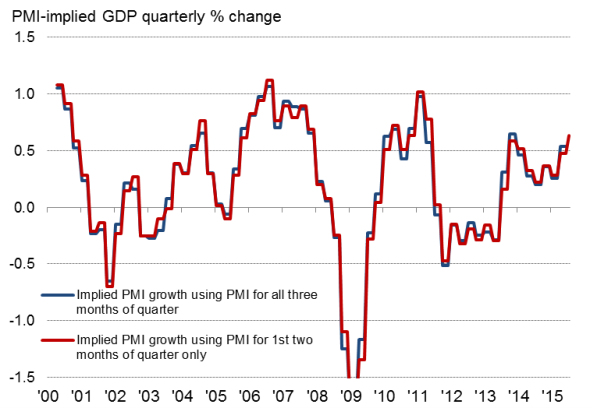
The above analysis can be repeated by using just the first two months' PMI readings for each quarter, as these averages are often almost identical to the average for the full quarter (see chart - they exhibit a correlation of 99%).
In fact, the implied GDP growth rate derived from using the PMI for just the first two months of the quarter has never diverged from the growth rate indicated by the full quarter PMI average by more than +/-0.2%, and never by more than +/-0.1% in any more than two instances.
This means that the above regression analysis and accompanying 'ready reckoner' presented here can be used to estimate GDP with reasonable accuracy by using just the first two months PMI data for each quarter, greatly enhancing the value of the PMI by taking advantage of the monthly publication of the survey data compared to the quarterly issuance of GDP numbers.
Limiting PMI data to first two months of the quarter

Please visit the research section of www.markit.com/commentary/economics for PMI-based GDP 'nowcasts' for other countries.